
In recent years, the number of published Mendelian randomization (MR) analyses has increased exponentially due to the widespread availability of genetic data and the explosion of genome-wide association studies (GWAS). By using genetic variants as instrumental variables for exposure, MR analysis is an epidemiological design that can strengthen causal inference. Compared with observational studies, MR analysis can reduce bias due to confounding because the genetic alleles are randomly selected at conception and therefore have no correlations with environmental and self-administered factors. However, GWAS results for therapeutic targets, such as plasma proteins, inflammatory cytokines, immune cells, eQTL genes, etc. are often insufficiently curated, undermining efficient implementation of the MR approach. To meet this need, we developed MRdb, a comprehensive database of curated GWAS results and MR applications for inferring causal relationships between therapeutic targets and phenotypes.
The integration of data and web tools in MRdb allows the rigorous application of hypothesis-driven analysis, enabling the efficient evaluation of millions of potential associations across phenotypes. MRdb curates thousands of GWAS results for therapeutic targets as exposures, including 19,126 eQTL genes, 4,907 plasma proteins, 1,400 plasma metabolites, 731 immune cells, 486 blood metabolites, 597 skin microbiota, 412 gut microbiota, 179 plasma lipids, 91 circulating proteins, 74 blood cells, 41 inflammatory cytokines and 8 thyroid hormones. MRdb also curates a number of 48,507 GWAS datasets as outcomes.
MRdb provides a user-friendly searching and analyzing interface. The Univariable MR analysis tool allows users to infer causal relationships between phenotypes, using a strategy known as 2-sample Mendelian randomization (2SMR). The Multivariable MR analysis tool was developed to estimate the effect of different mediators on the risk of outcome phenotypes with adjustment for exposures (e.g. adjustment for BMI, smoking initiation and type 2 diabetes mellitus). To assess the sensitivity of different patterns to MR results, MRdb provides a range of diagnostics and sensitivity analyses, including Heterogeneity test, Horizontal pleiotropy test, Horizontal pleiotropy test and Leave-one-out Validation. These results can be visualized as MR Plots, Funnel Plots, Forest Plots and Density Plots. Based on MRdb, user-definable parameters are set for all analysis steps. All data and analyses are freely accessible and downloadable. The MRdb is regularly updated by combining the latest genetic data with the latest statistical methods. Collectively, MRdb will serve as an important resource for investigating the potential causal relationships between therapeutic targets and phenotypes.
1. Main functions of the MRdb are provided in menu bar form (boxed in green).
2. Click "Get Start" button to select an exposure dataset of interest for Mendelian randomization.
3. Click "Analysis" button to select a univariate/multivariate analysis for Mendelian randomization.
4. Click "Get Help" button to get helps of MRdb.
5. This panel displays basic information about the exposure datasets built into MRdb, and you can click on any exposure dataset to perform univariate/multivariate Mendelian randomization analysis.

Figure 1-1
1. In the "Exposure (Univariate)" section, input or select the exposure dataset for Mendelian randomization analysis.
2. Click on the pre-defined example datasets (e.g., "IL-10", "CTACK") to quickly fill in exposure data for demonstration purposes.
3. Navigate to the "Outcome" section and input or select the outcome dataset for analysis.
4. Utilize the example buttons (e.g., "Alzheimer disease", "Abscess of lung") to quickly load pre-defined outcome datasets for demonstration.
5. Adjust univariate analysis parameters under the "Params" section, including thresholds, methods, and additional settings to customize the analysis process.
6. Once the configurations are set, click the "Submit" button to execute the univariate analysis.
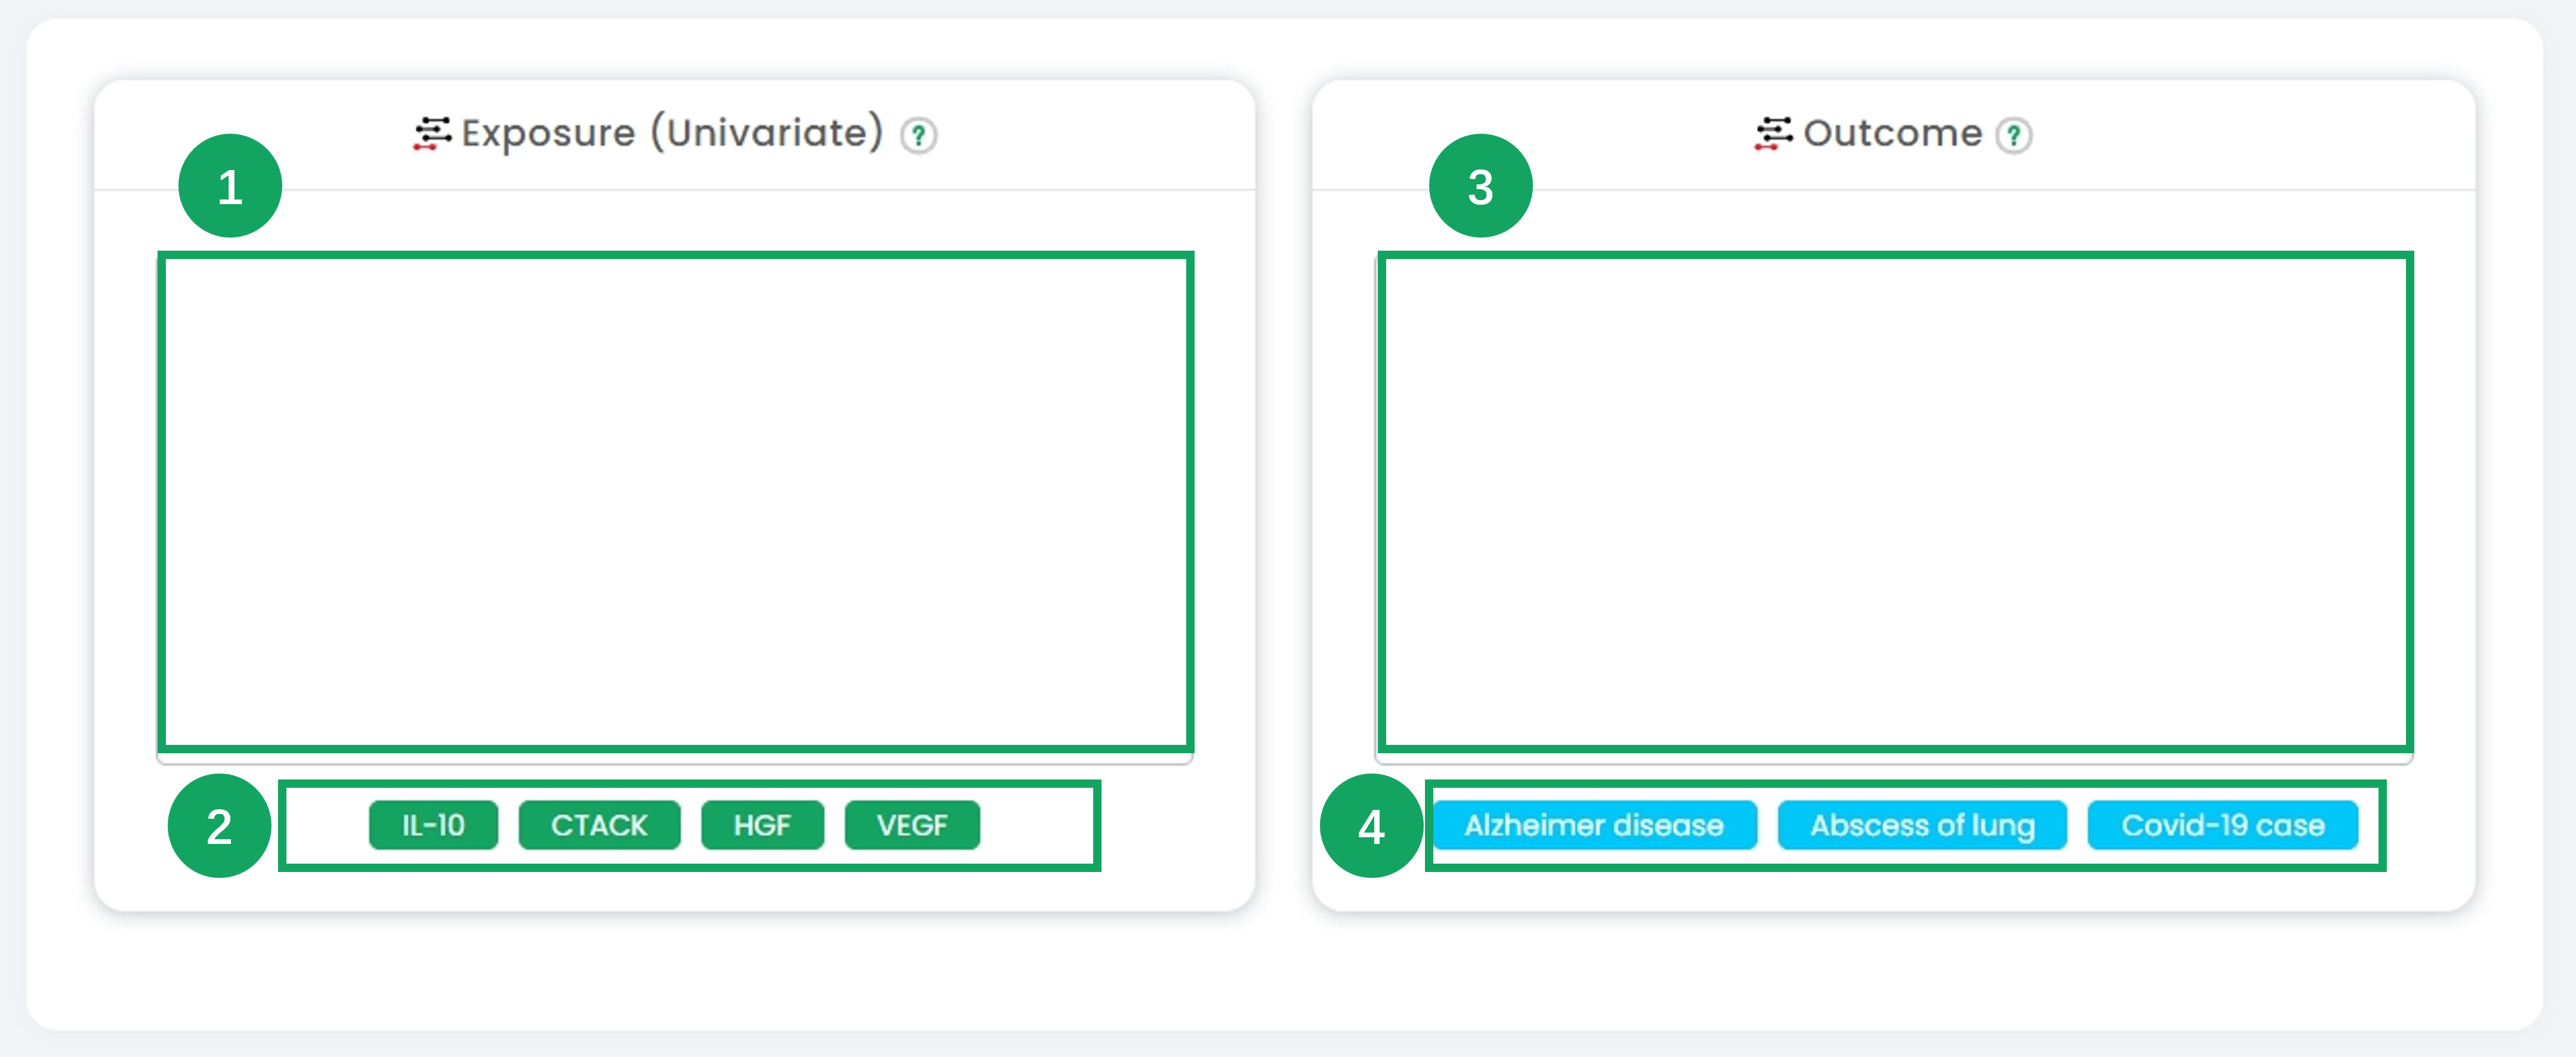
Figure 2-1
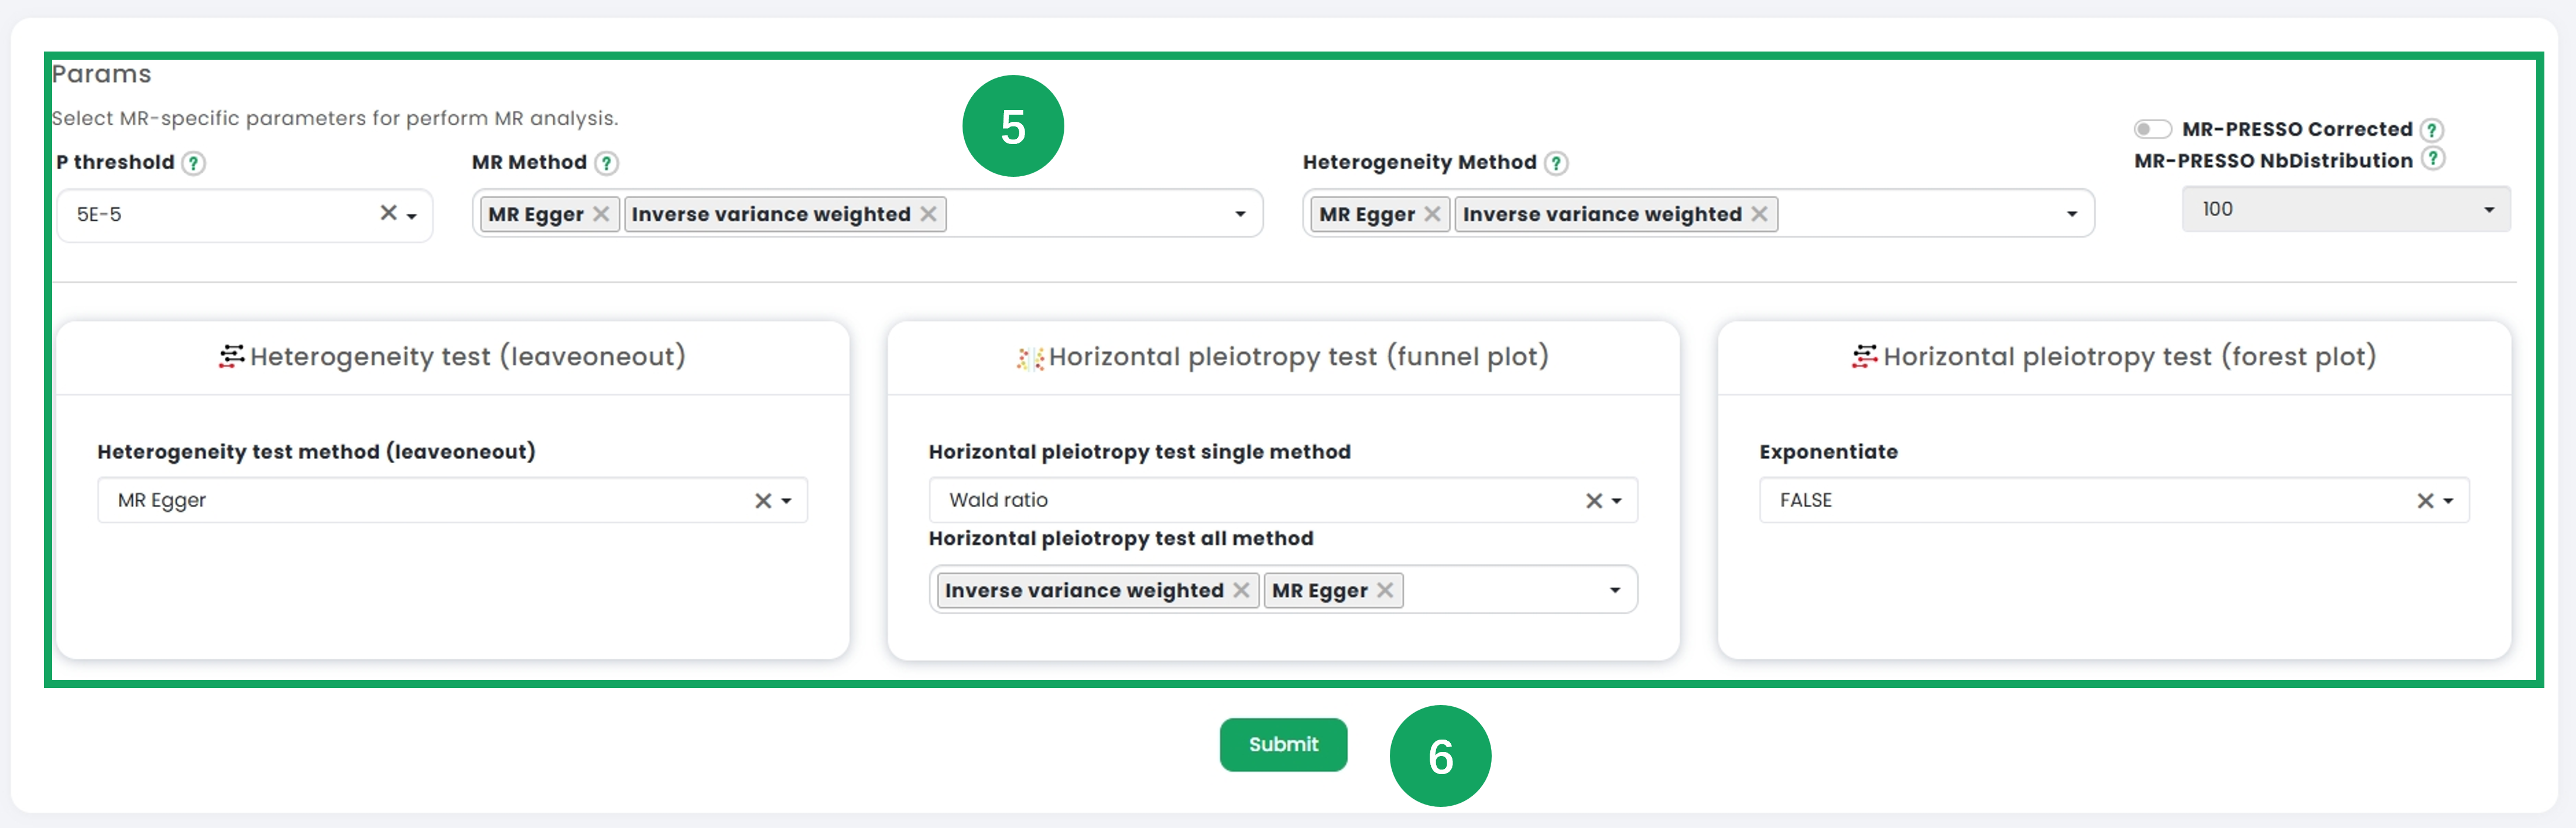
Figure 2-2
7. In the "Exposure (Multivariate)" section, input or select the exposure datasets for Mendelian randomization multivariate analysis.
8. Click on the pre-defined example datasets (e.g., "IL-10", "CTACK") to quickly populate multiple exposure variables for demonstration.
9. Navigate to the "Outcome" section and input or select the outcome dataset for multivariate analysis.
10. Use the example buttons (e.g., "Alzheimer disease", "Abscess of lung") to load pre-defined outcome datasets for multivariate analysis demonstration purposes.
11. Configure the advanced multivariate parameters under the "Params" section, including variable thresholds, model selection, and distribution types to suit the analytical needs.
12. After confirming all configurations, click the "Submit" button to run the multivariate analysis.

Figure 2-3
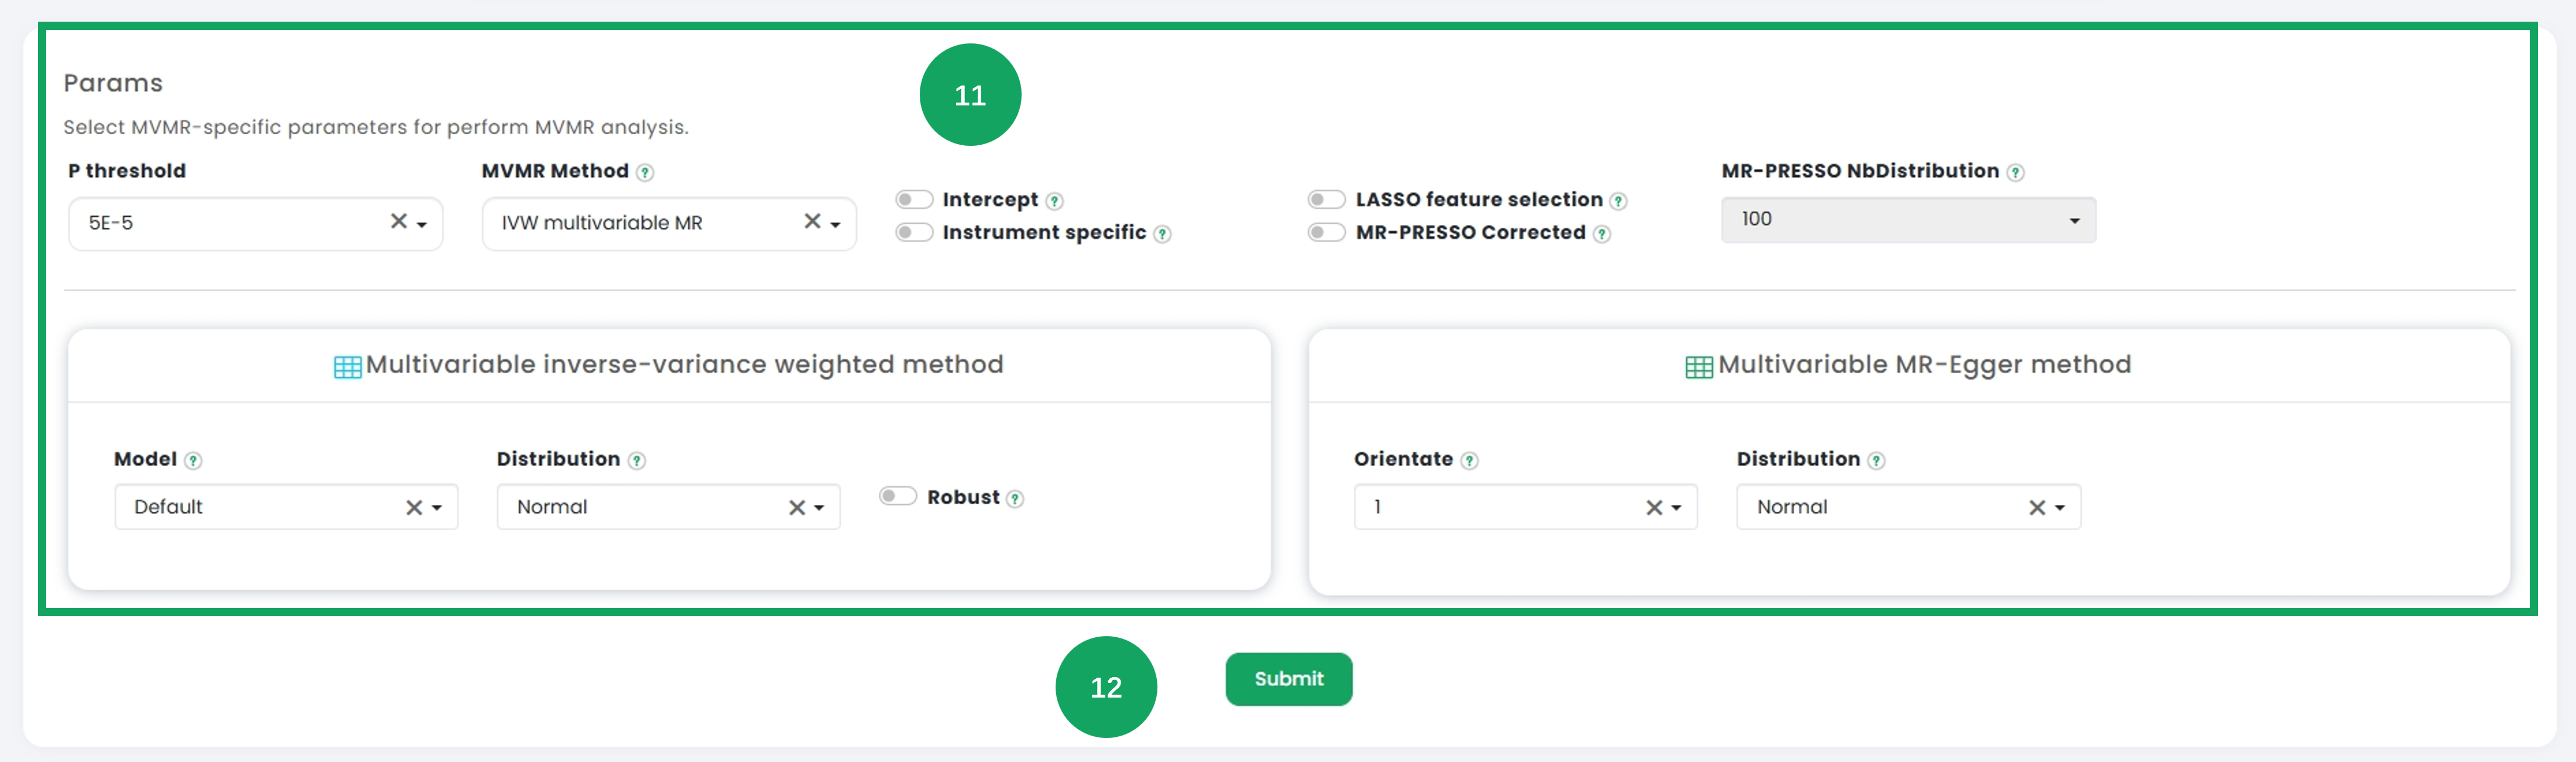
Figure 2-4
1. Click to select an exposure dataset.
2. Further filtering based on the currently selected dataset.
3. Click on one dataset in the table that interests you as the exposure data in Mendelian randomization univariate analysis.
4. Filter the outcome dataset you are interested in.
5. Click on one dataset in the table that interests you as the outcome data in Mendelian randomization univariate analysis.
6. To display your selected dataset (exposure data and outcome data), you can click on the table icon on the right to view the raw dataset.
7. Choose a variety of univariate Mendelian randomization parameters for analysis.
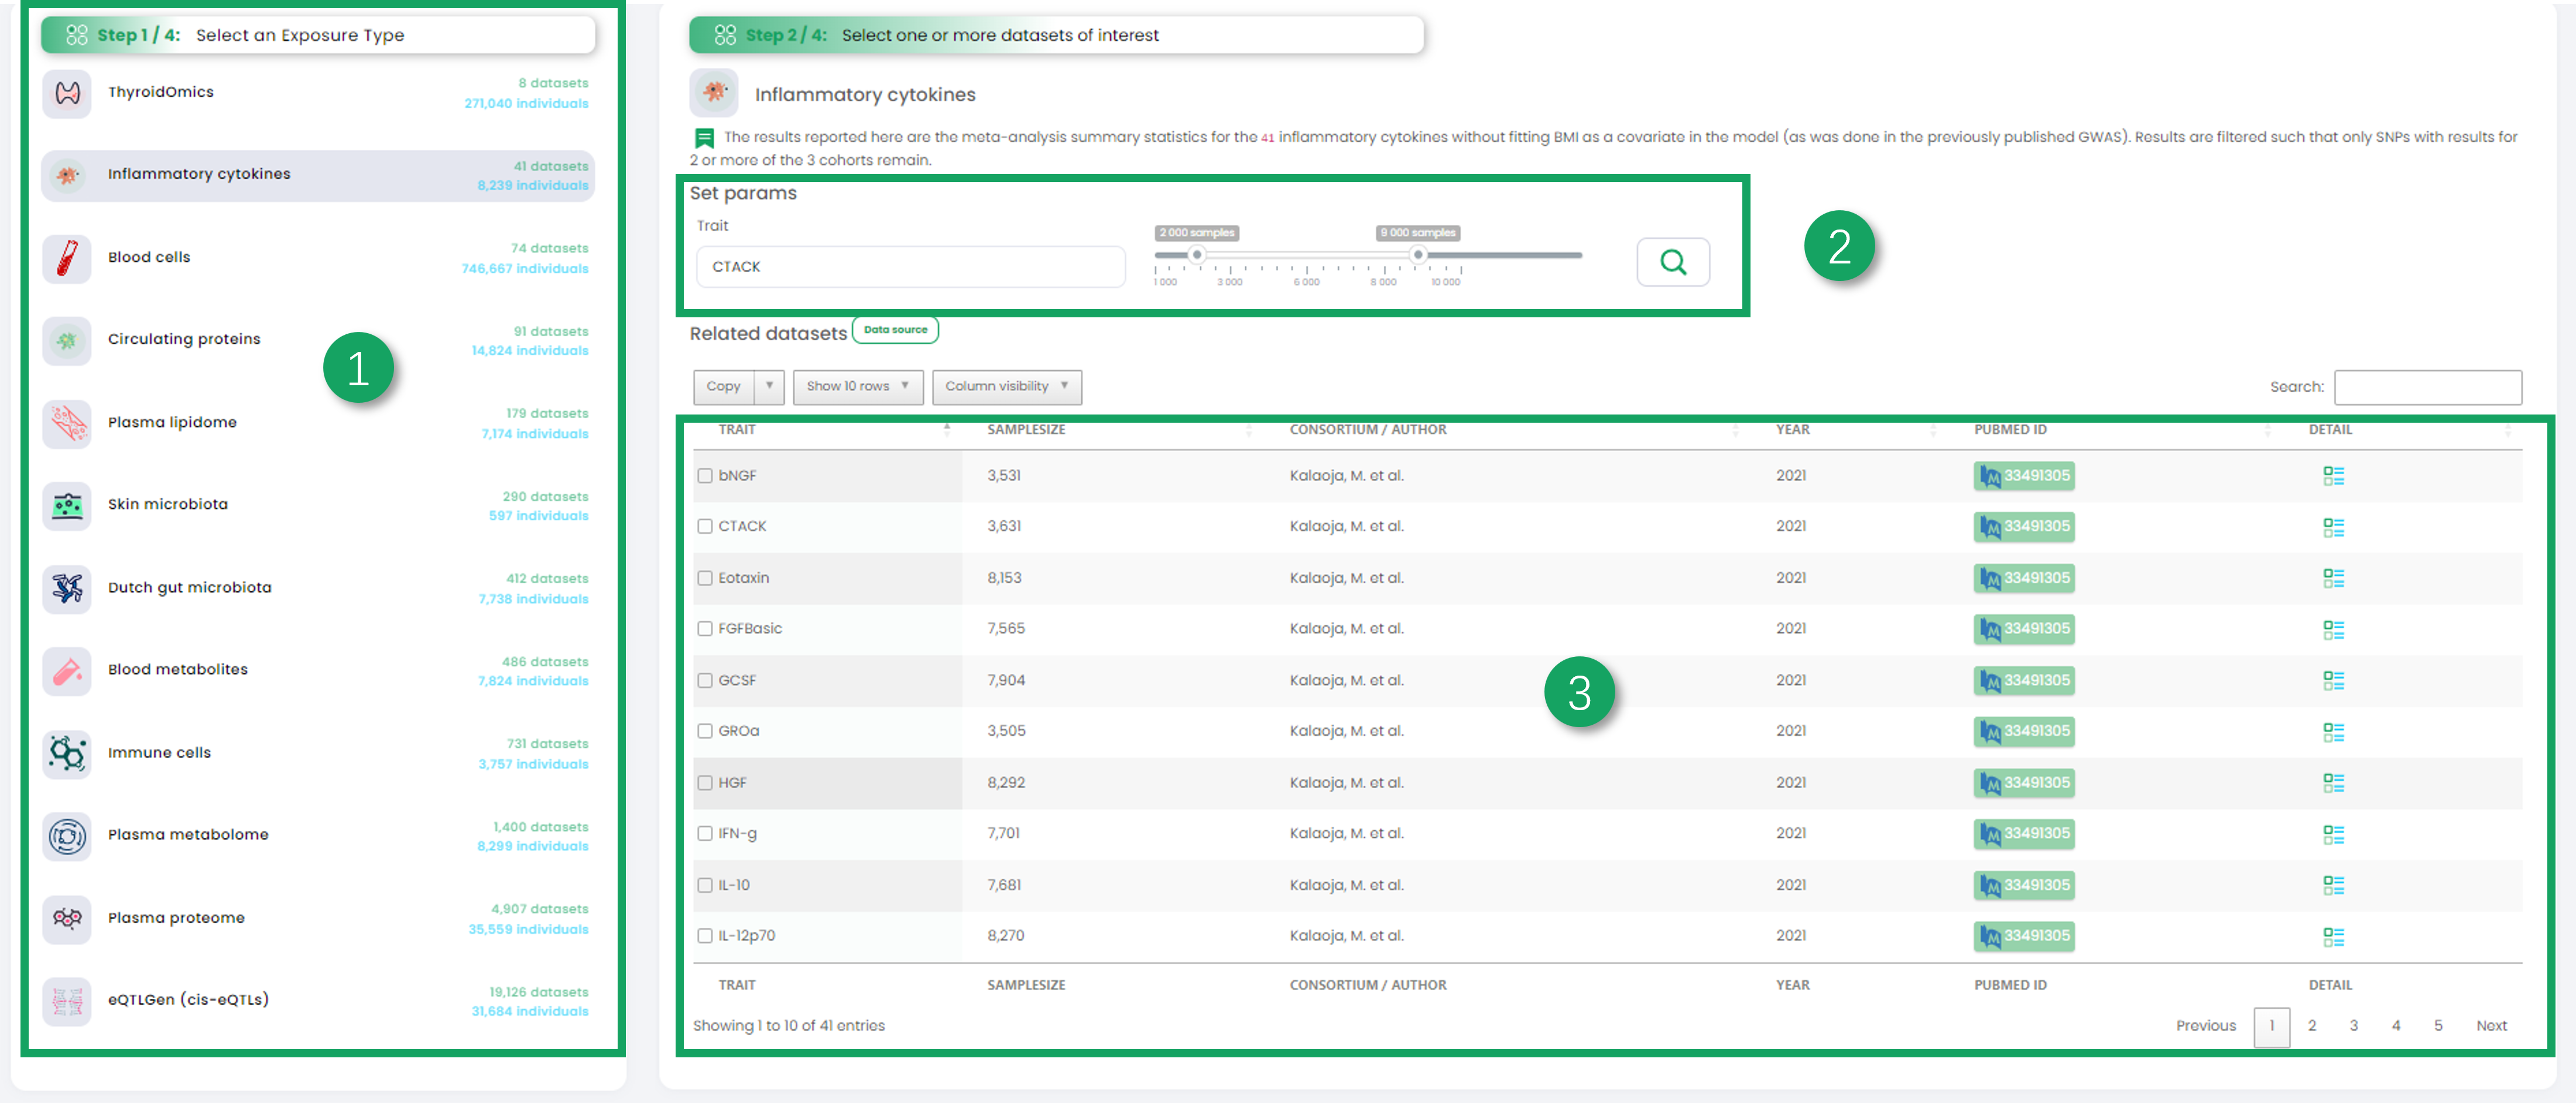
Figure 3-1

Figure 3-2
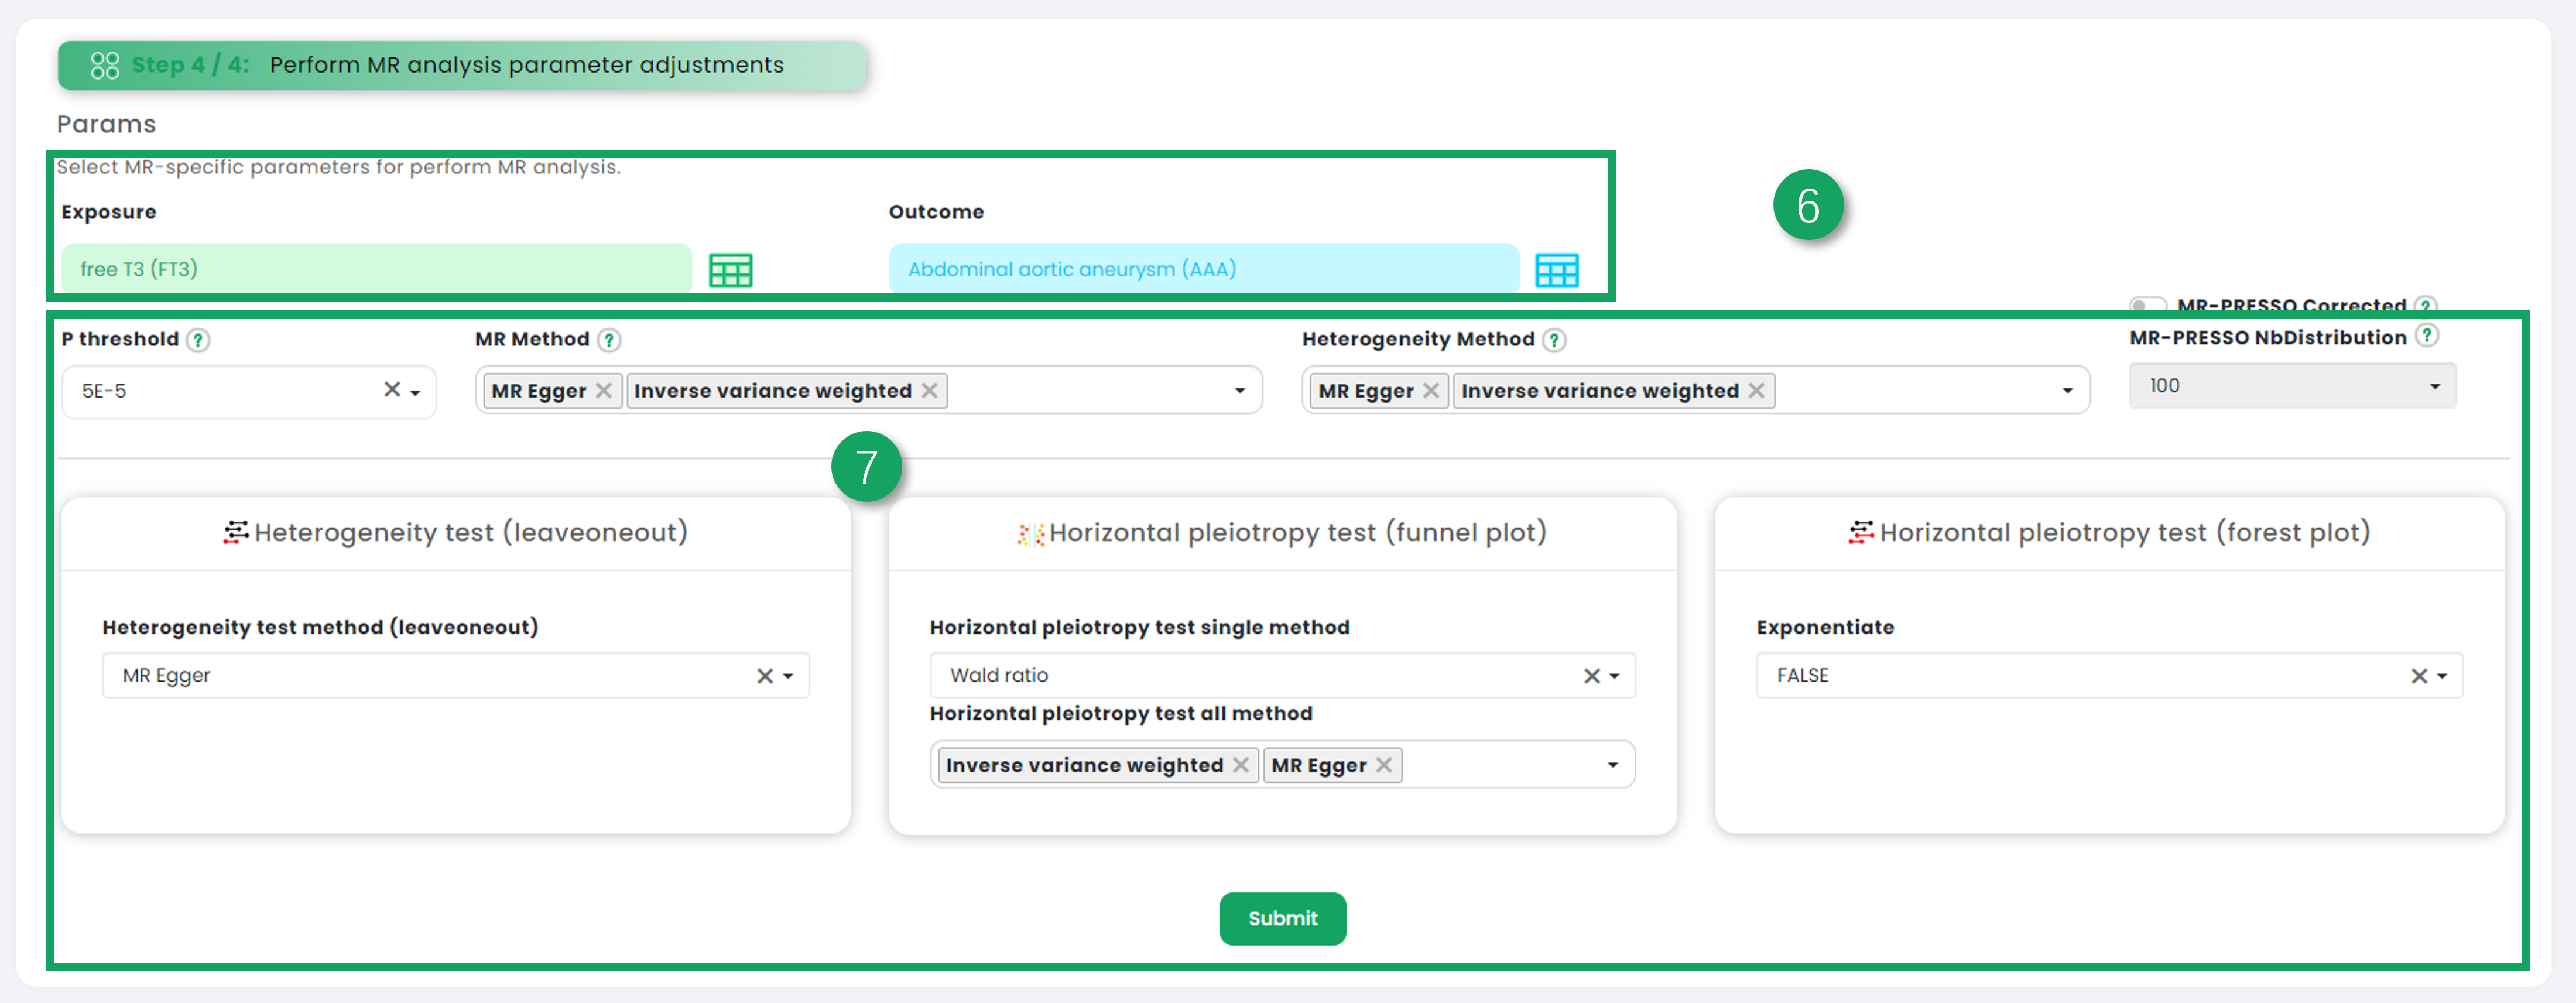
Figure 3-3
1. Exposure dataset basic information.
2. Outcome dataset basic information.
3. Harmonise Result.
4. MR Result.
5. Heterogeneity Test.
6. Pleiotropy Test.
7. MR Plot.
8. Leave-one-out Validation.
9. Funnel Plot.
10. Forest Plot.
11. Density Plot
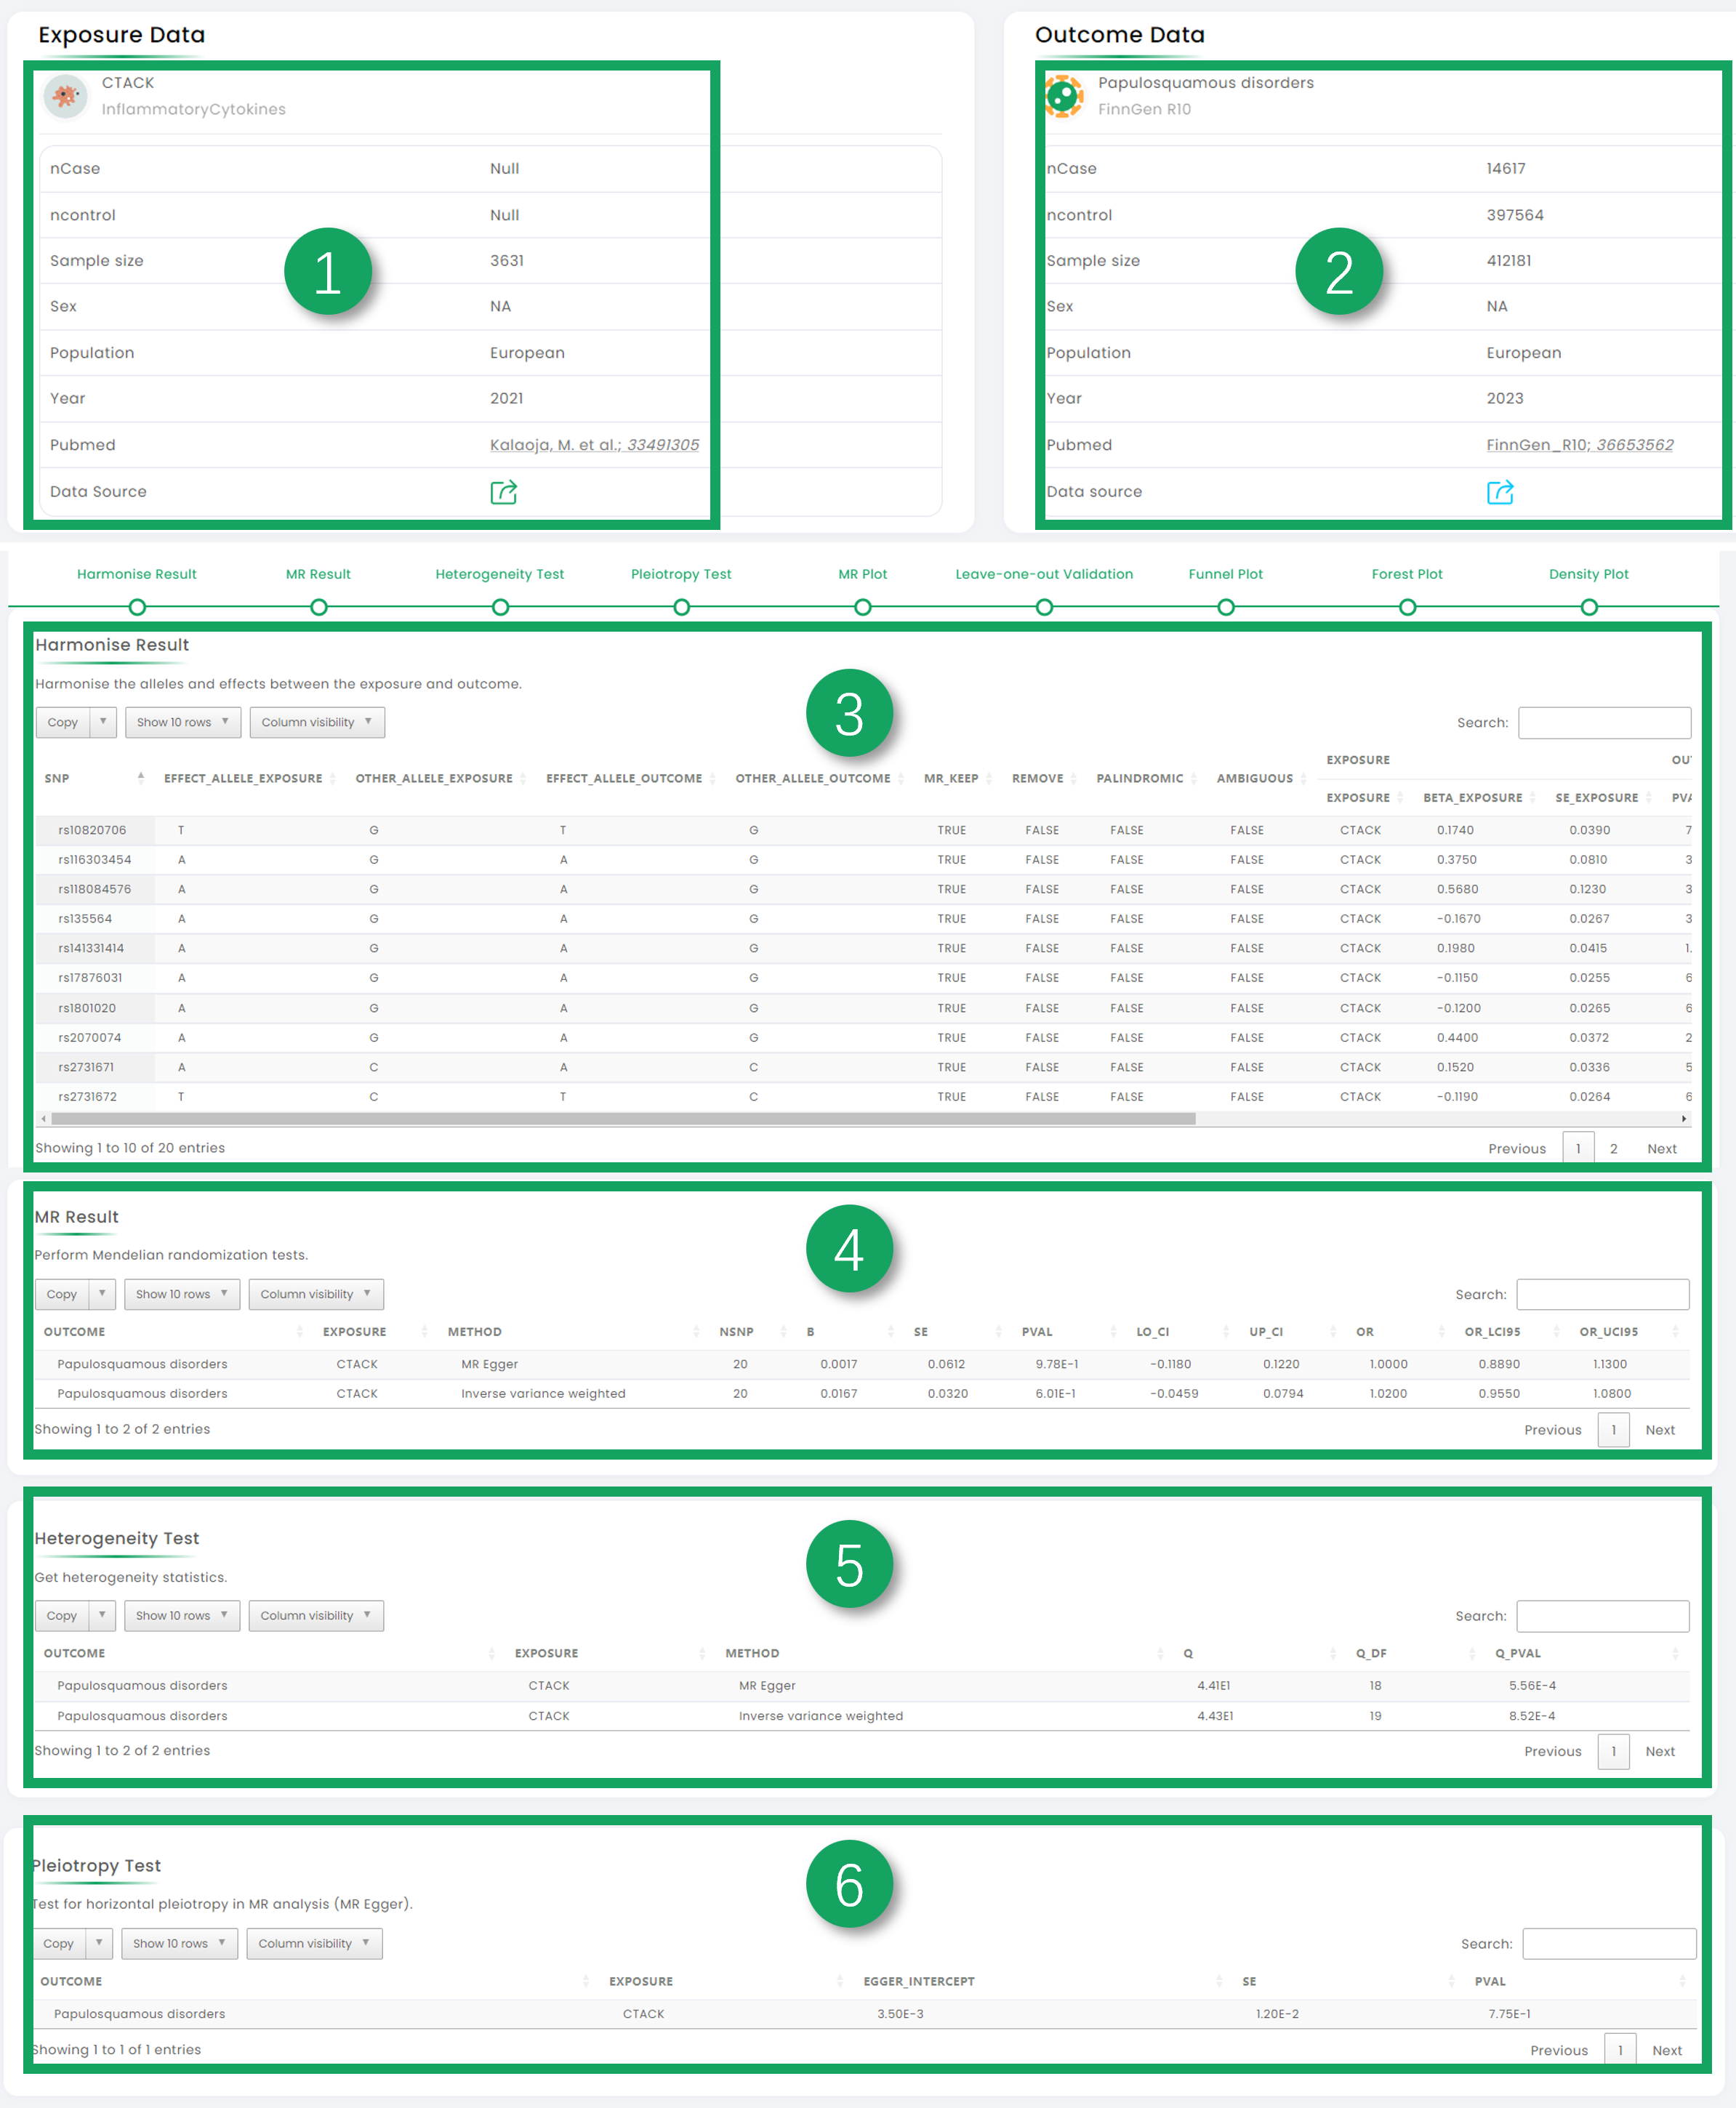
Figure 4-1
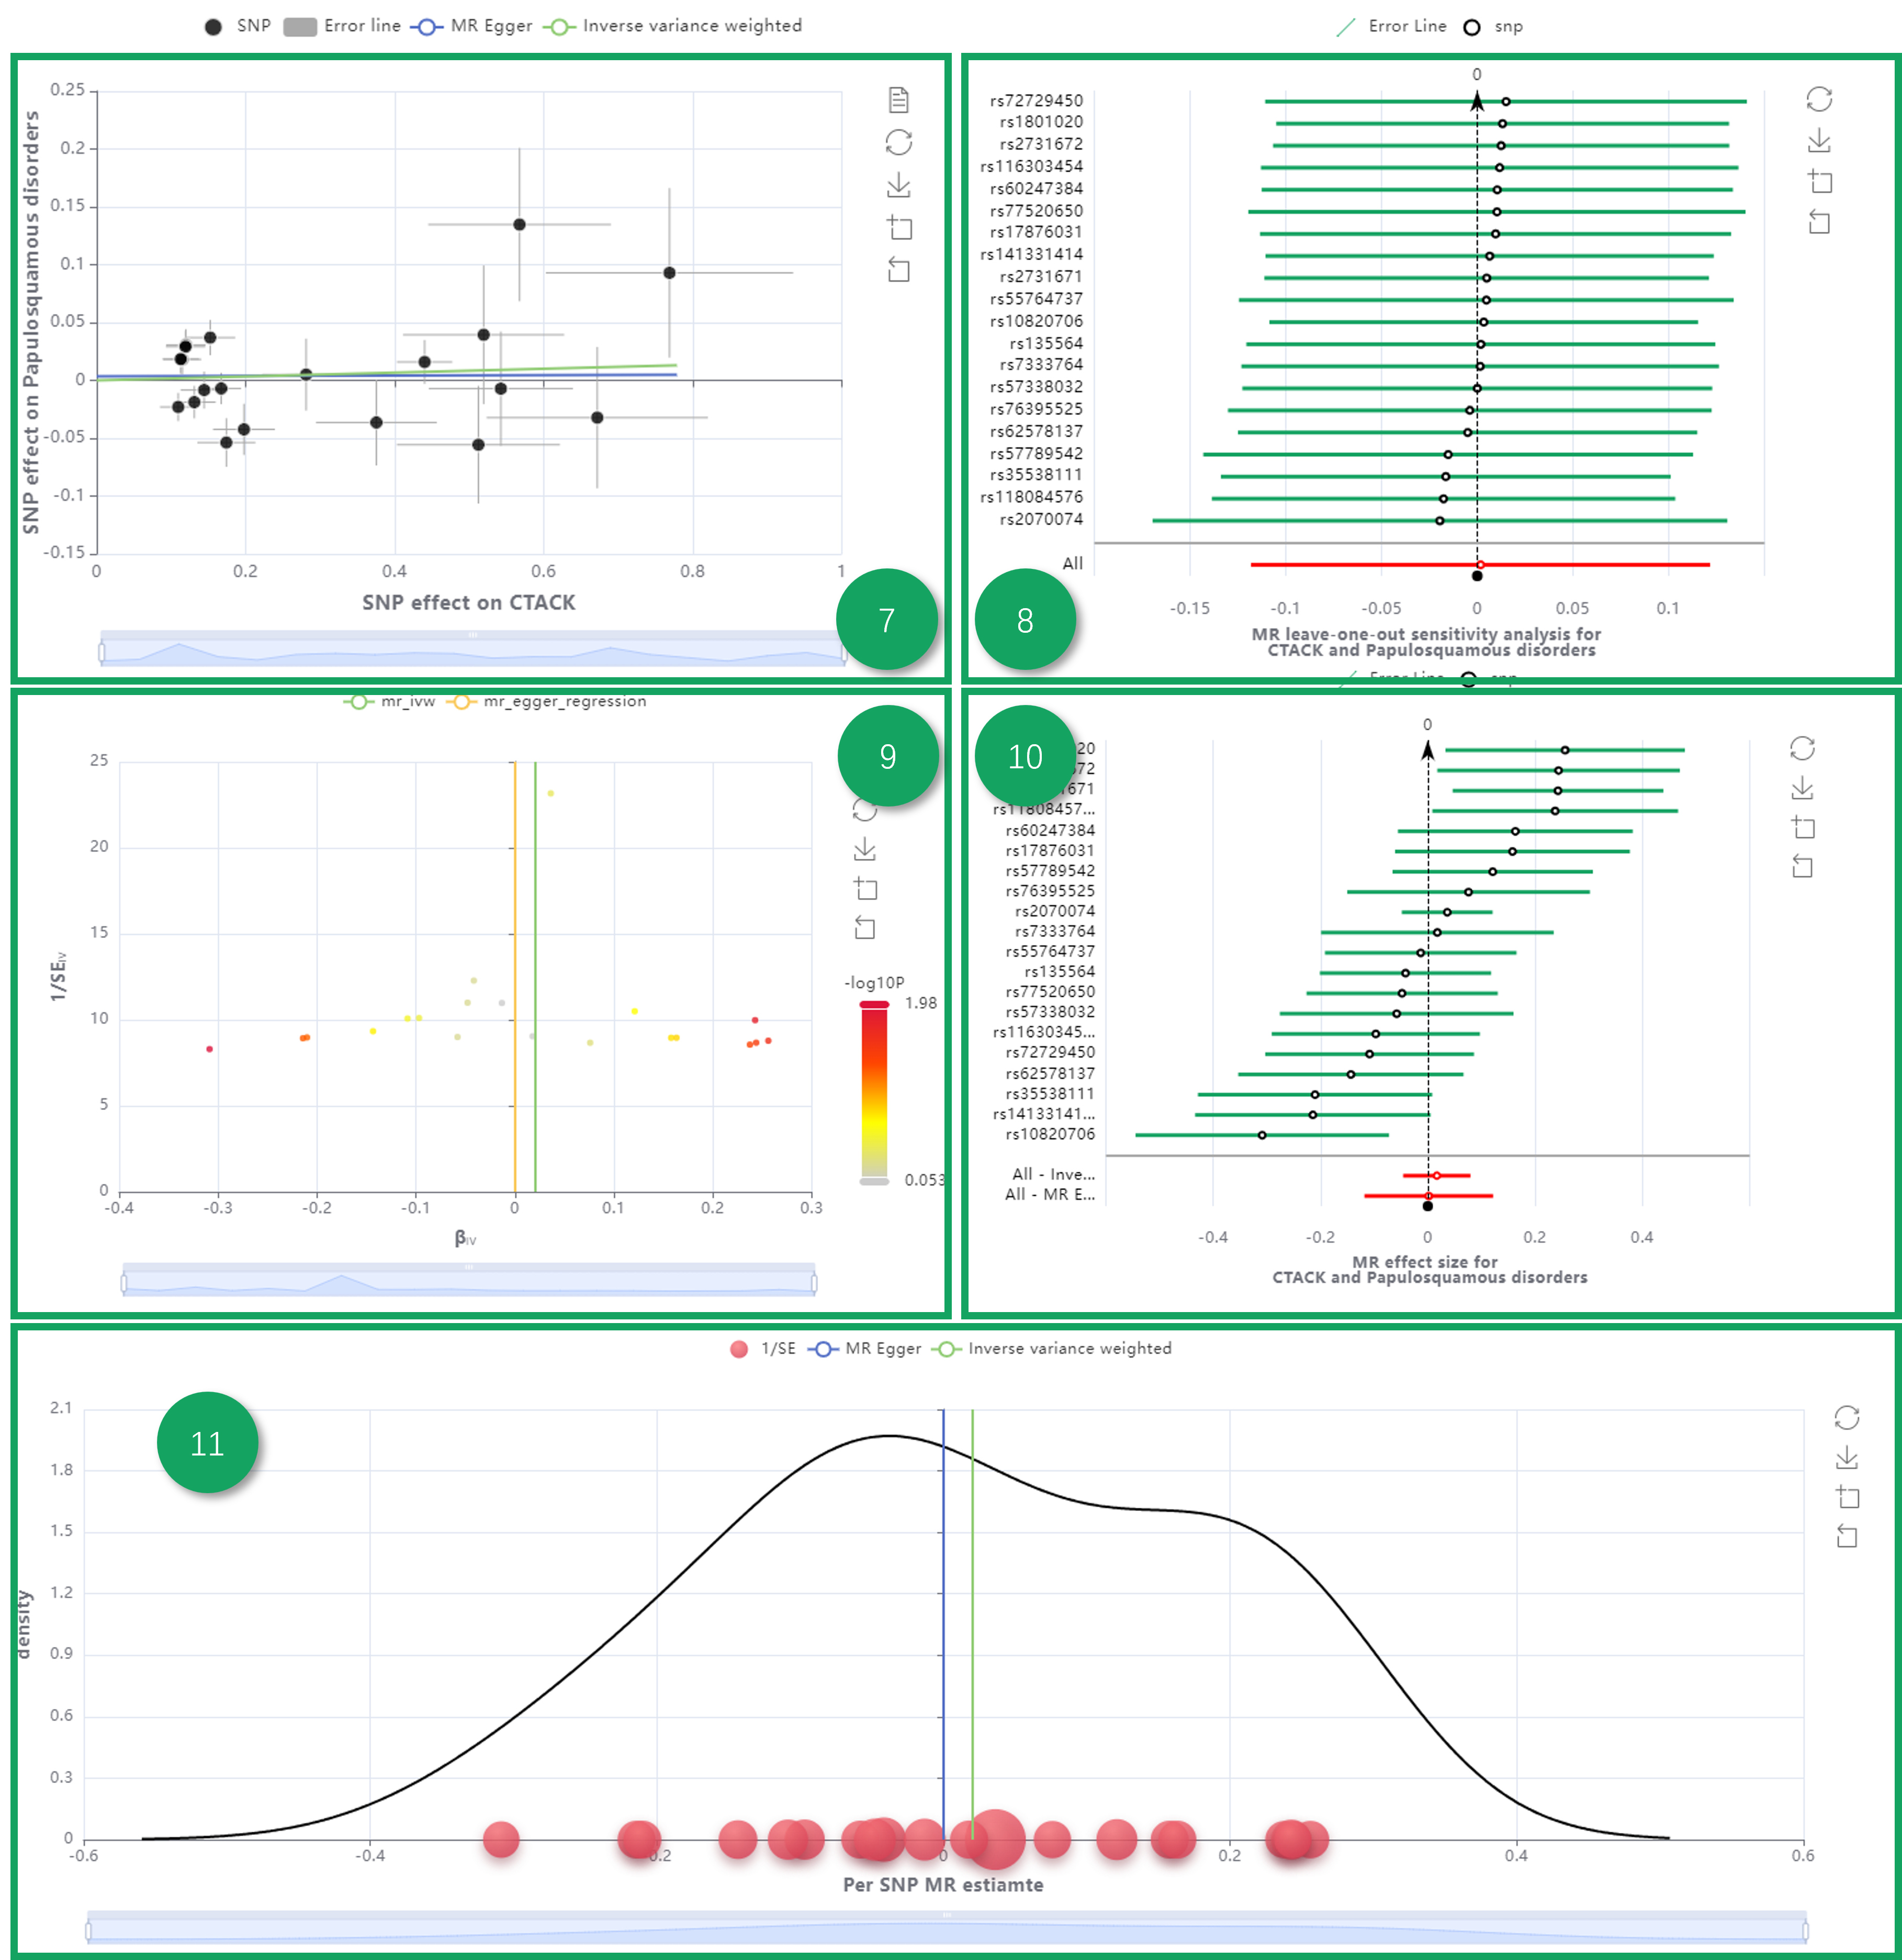
Figure 4-2
1. Click to select exposure datasets.
2. Further filtering based on the currently selected dataset.
3. Click on one dataset (greater than or equal to 2 and less than or equal to 5) in the table that interests you as the exposure data in Mendelian randomization multivariate analysis.
4. Filter the outcome dataset you are interested in.
5. Click on one dataset in the table that interests you as the outcome data in Mendelian randomization multivariate analysis.
6. To display your selected dataset (exposure datasets and outcome data), you can click "extra exposure" to add additional exposure datasets.
7. Choose a variety of multivariate Mendelian randomization parameters for analysis.

Figure 5-1
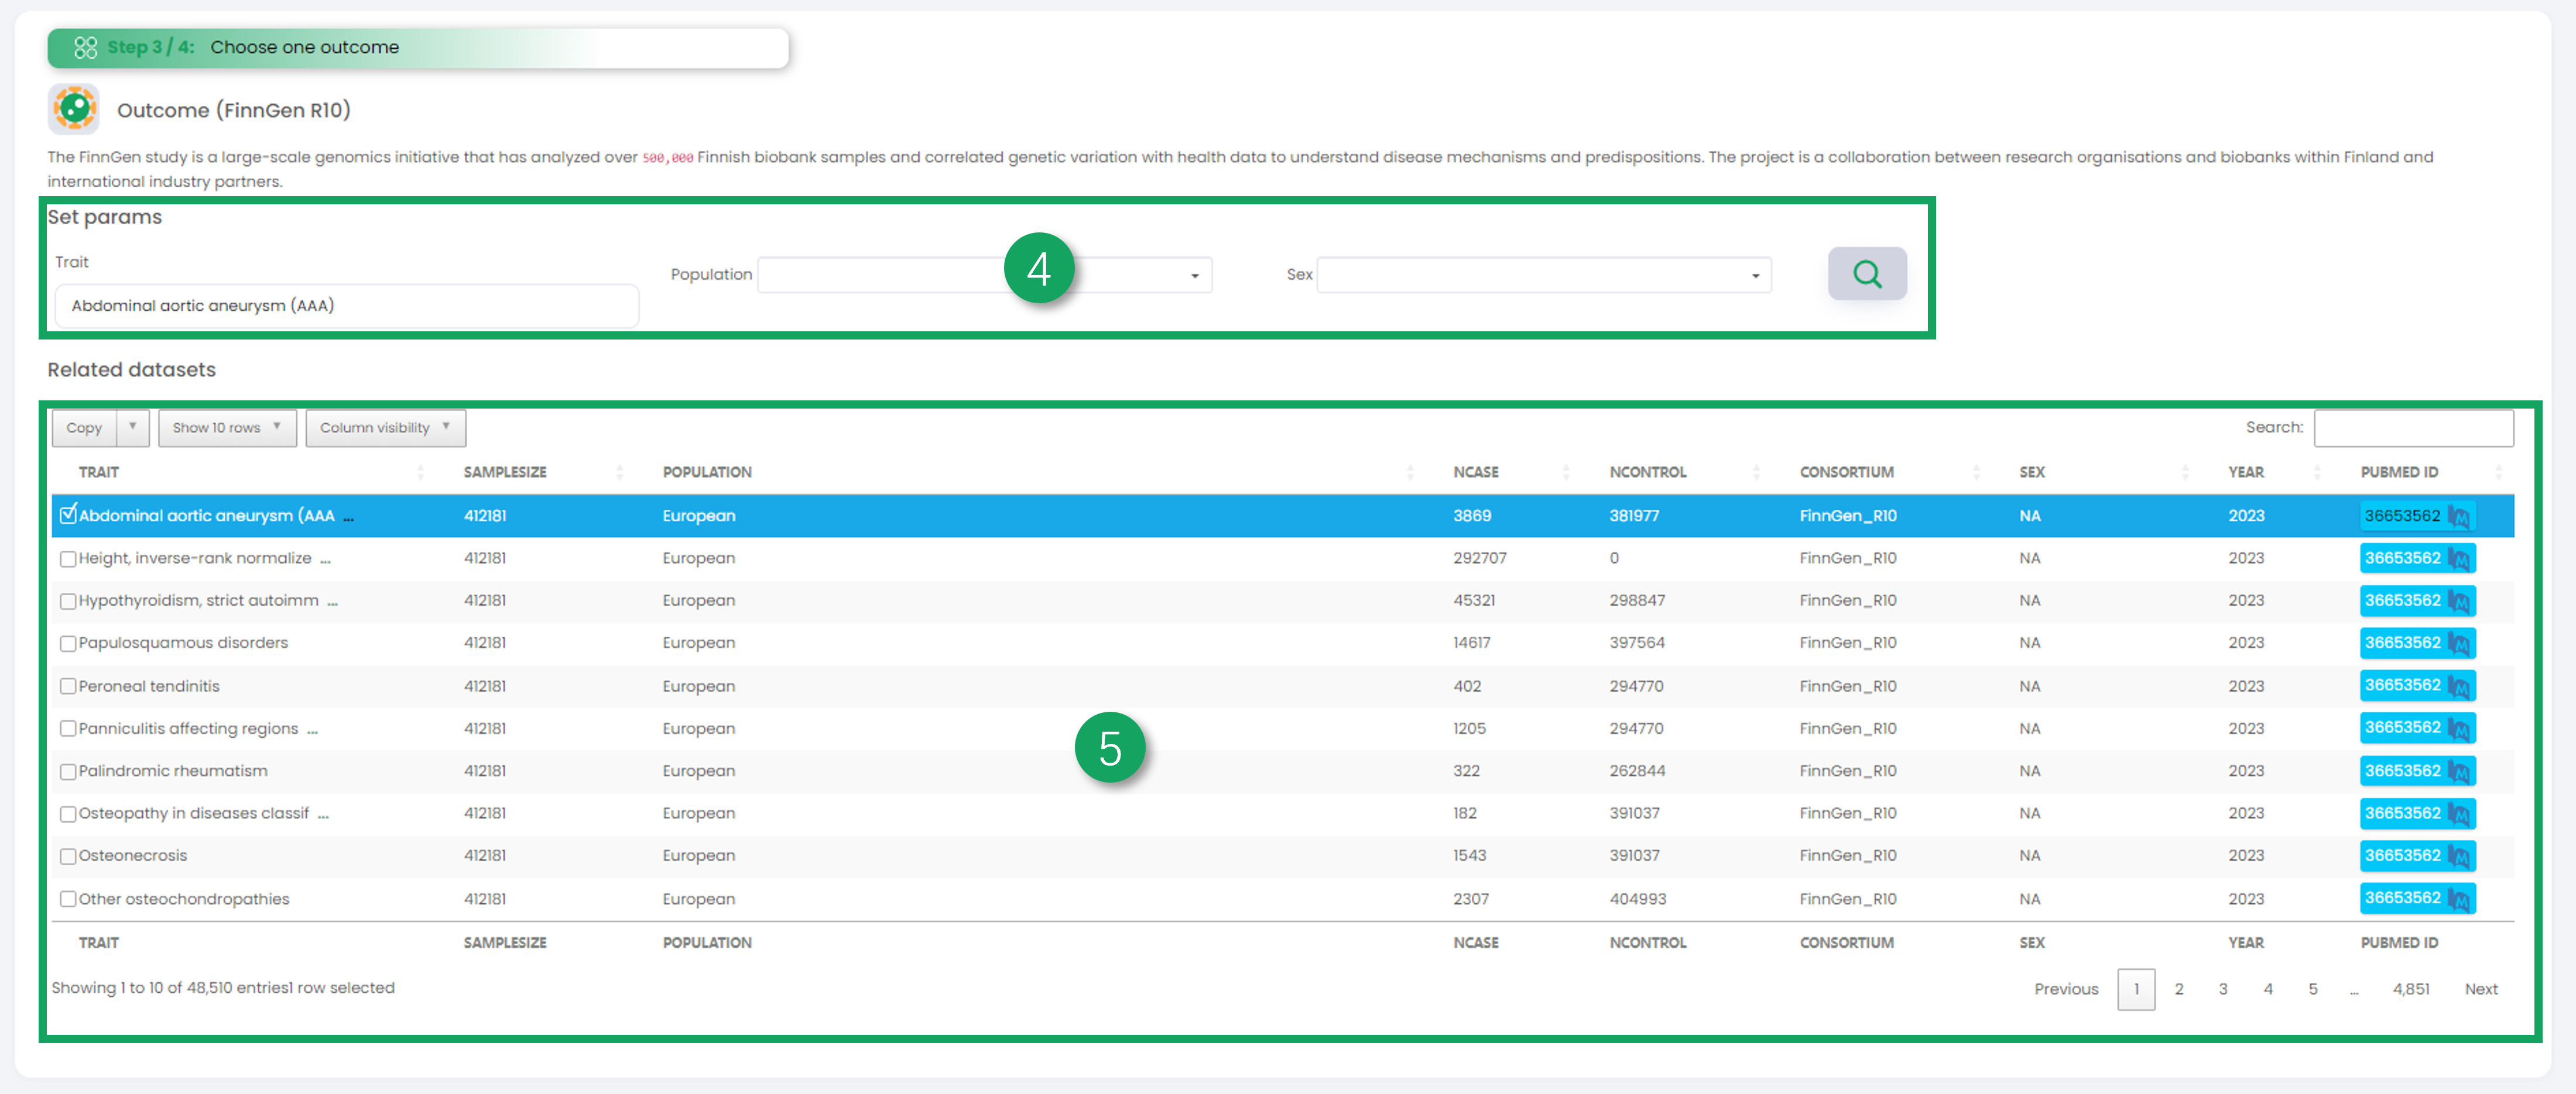
Figure 5-2
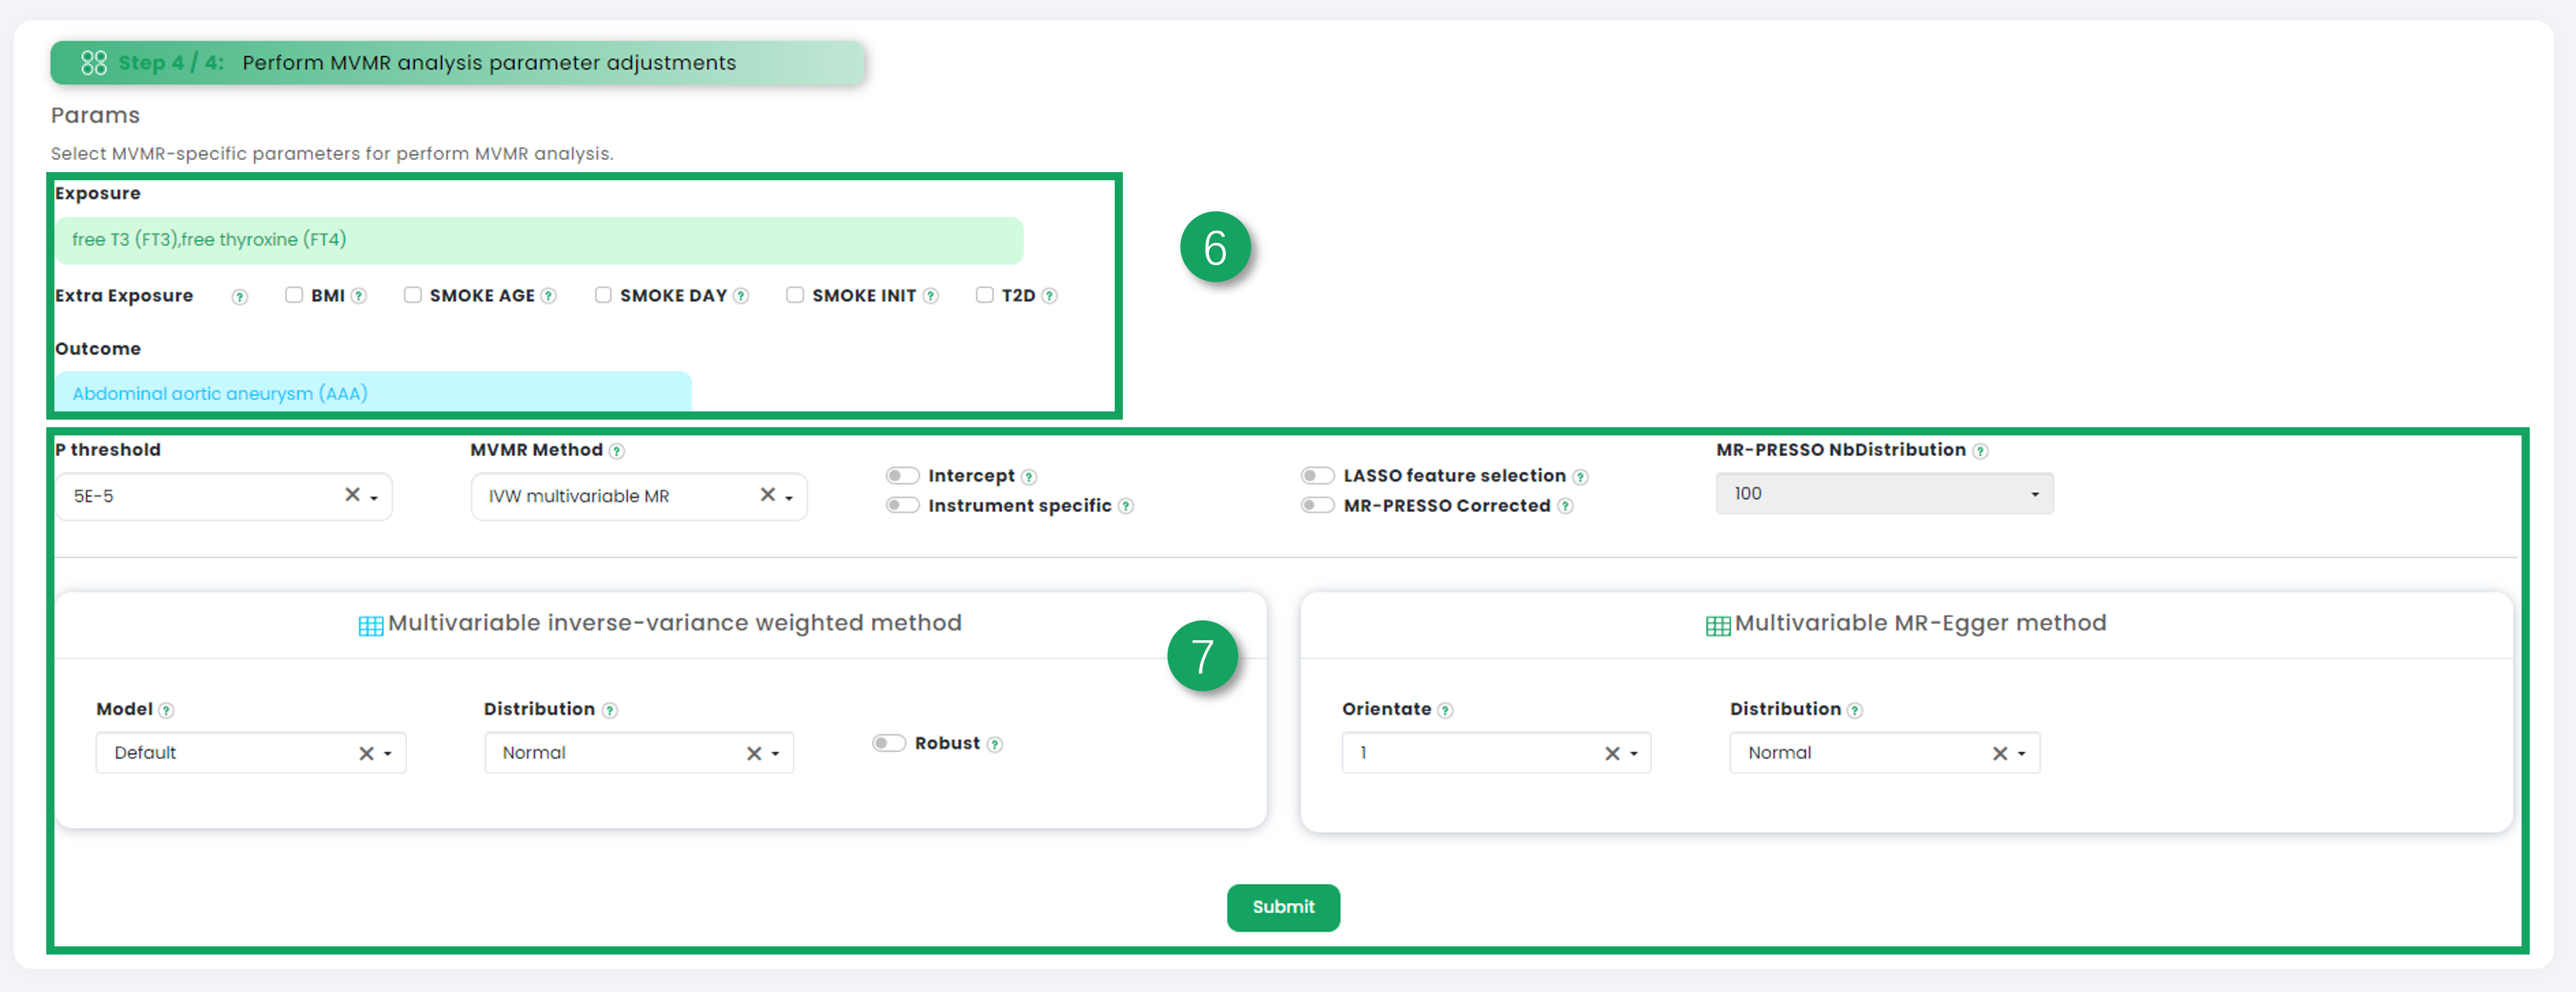
Figure 5-3
1. MVMR Result.
2. Exposure datasets basic information.
3. Outcome dataset basic information.
4. MV-IVW Result.
5. MV-EGGER Result.
6. MRMV-IVW Result.
7. F statistic.
8. Q table.
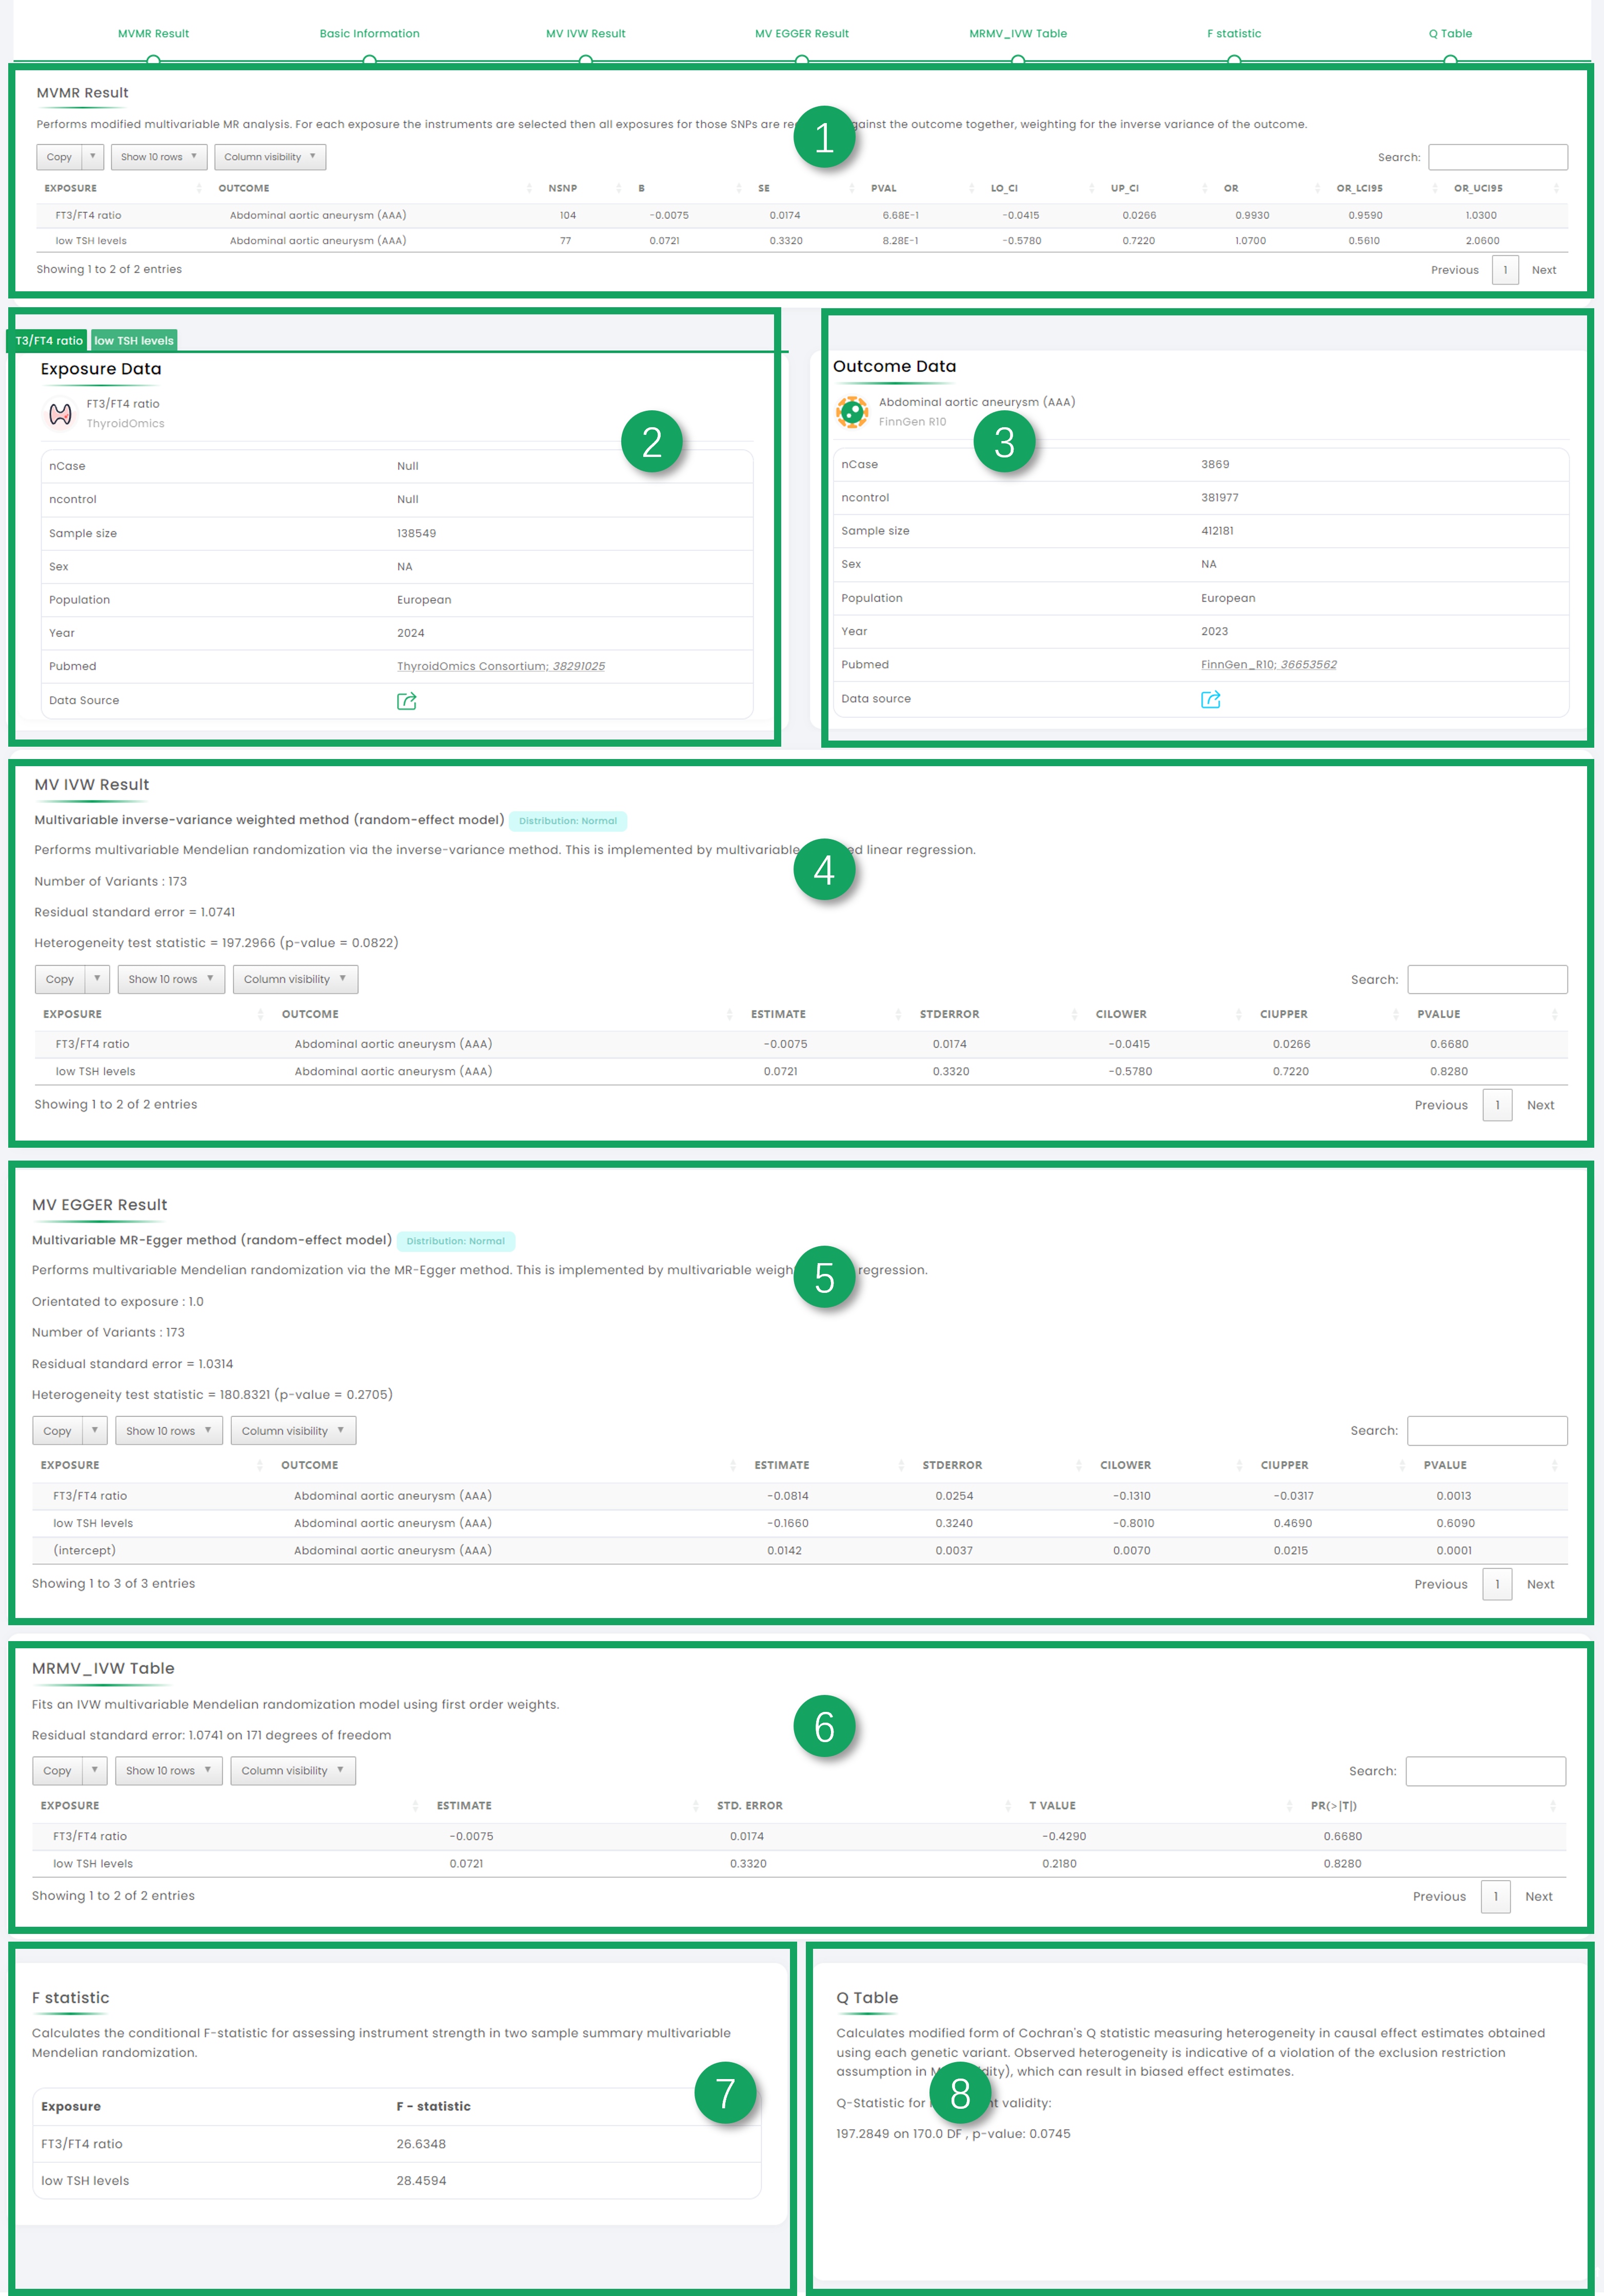
Figure 6-1
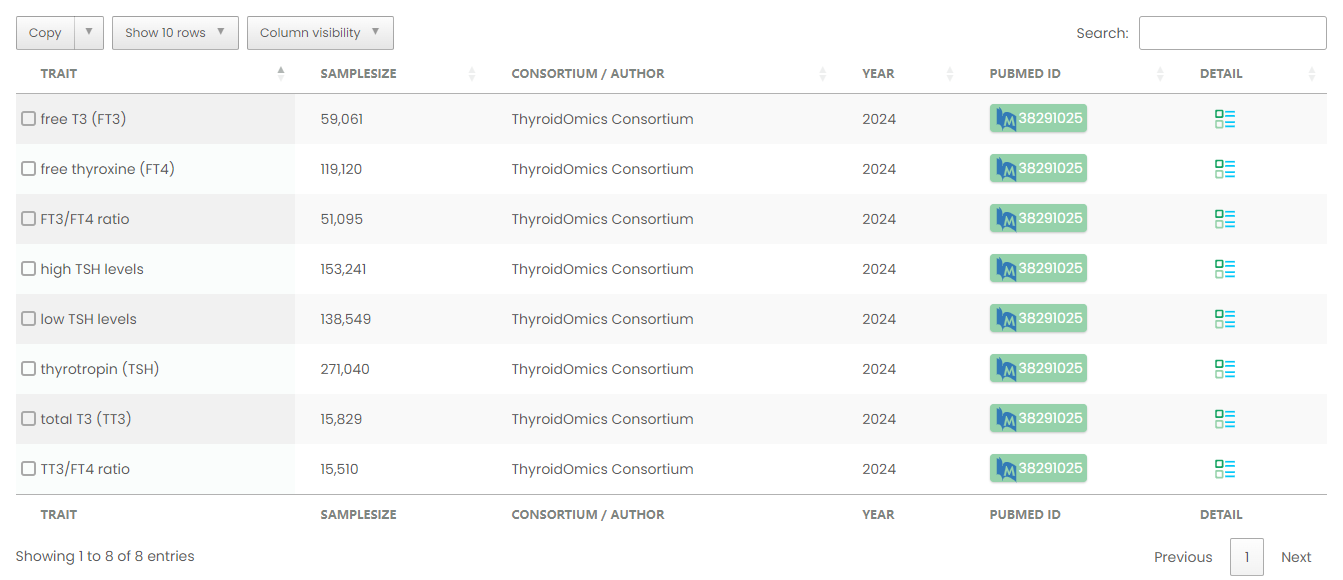
Figure 7-1
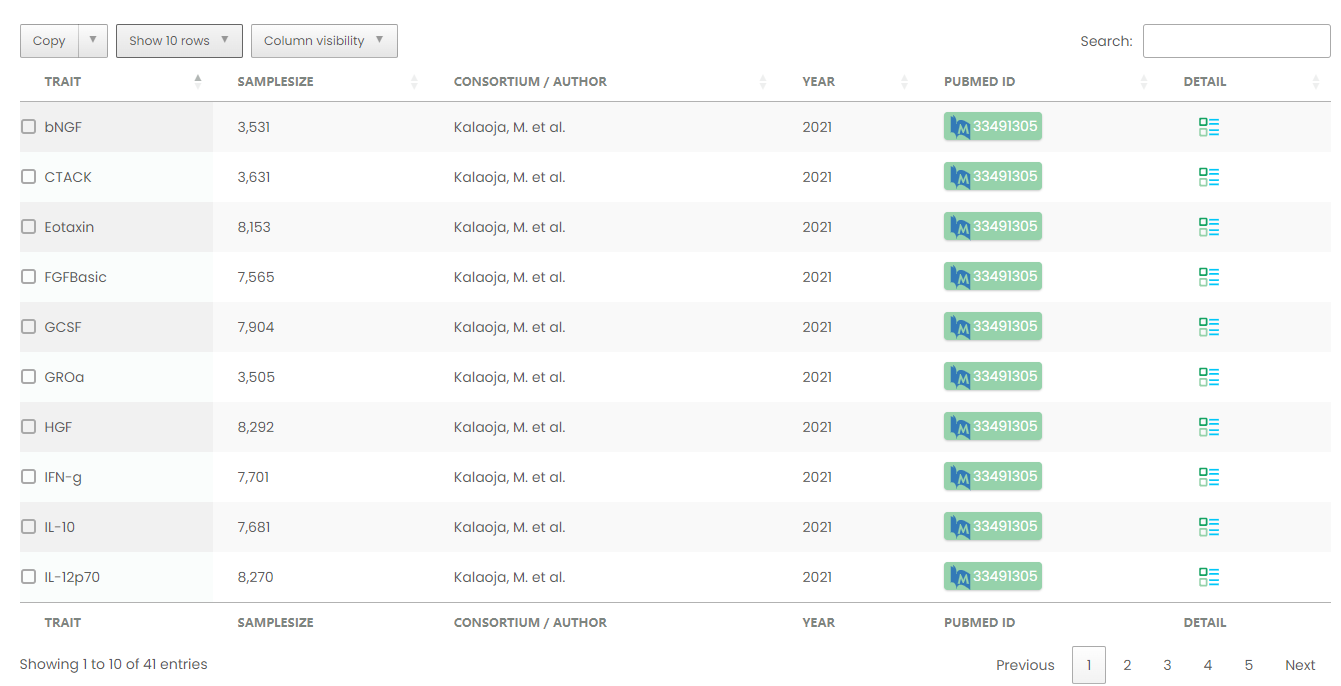
Figure 8-1
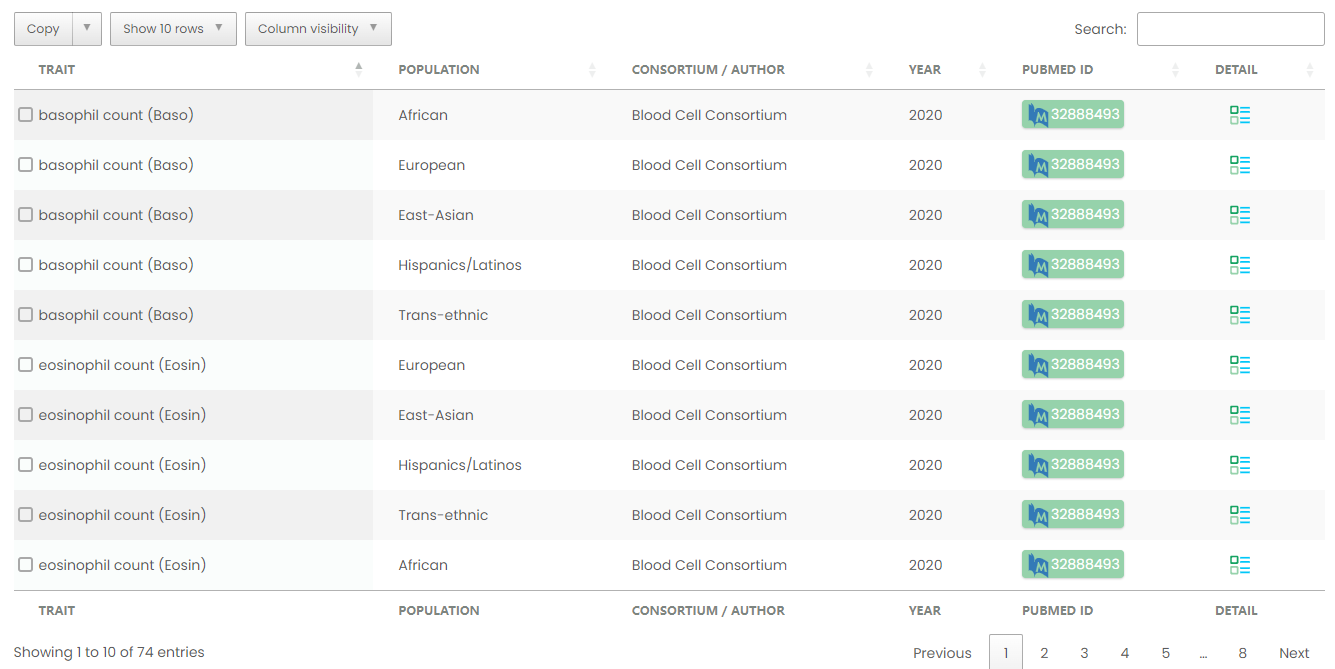
Figure 9-1
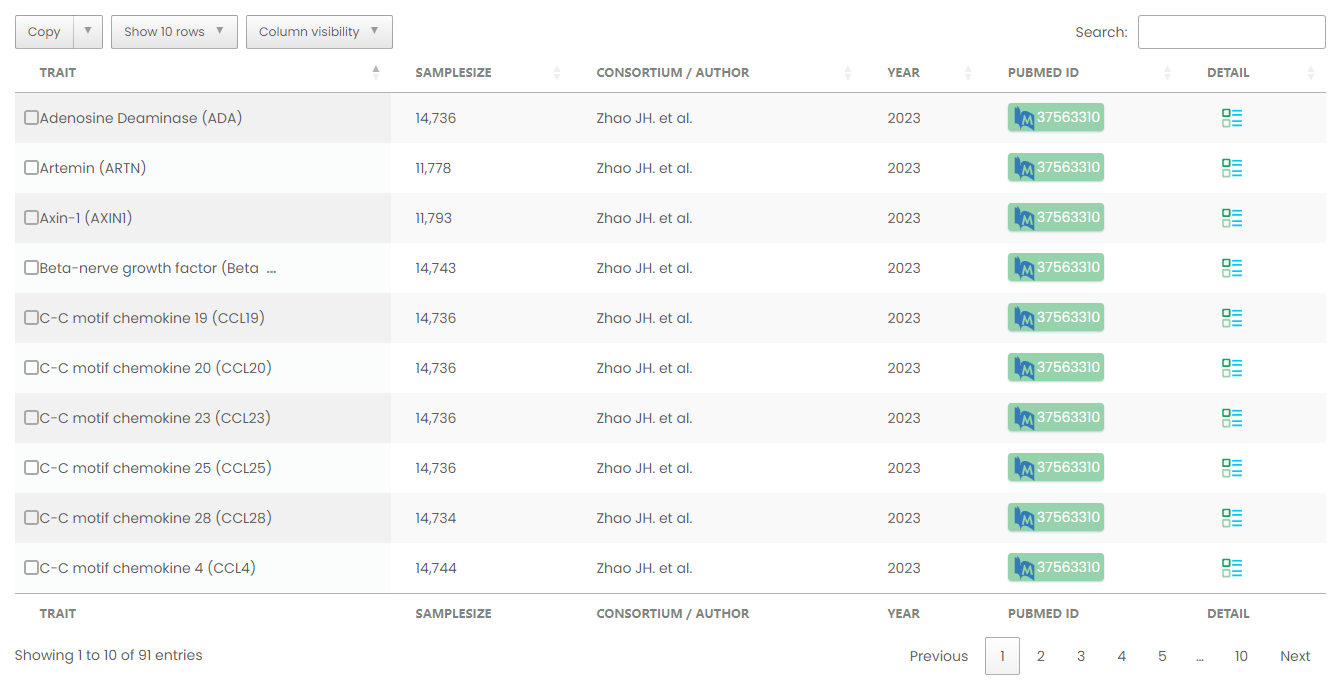
Figure 10-1
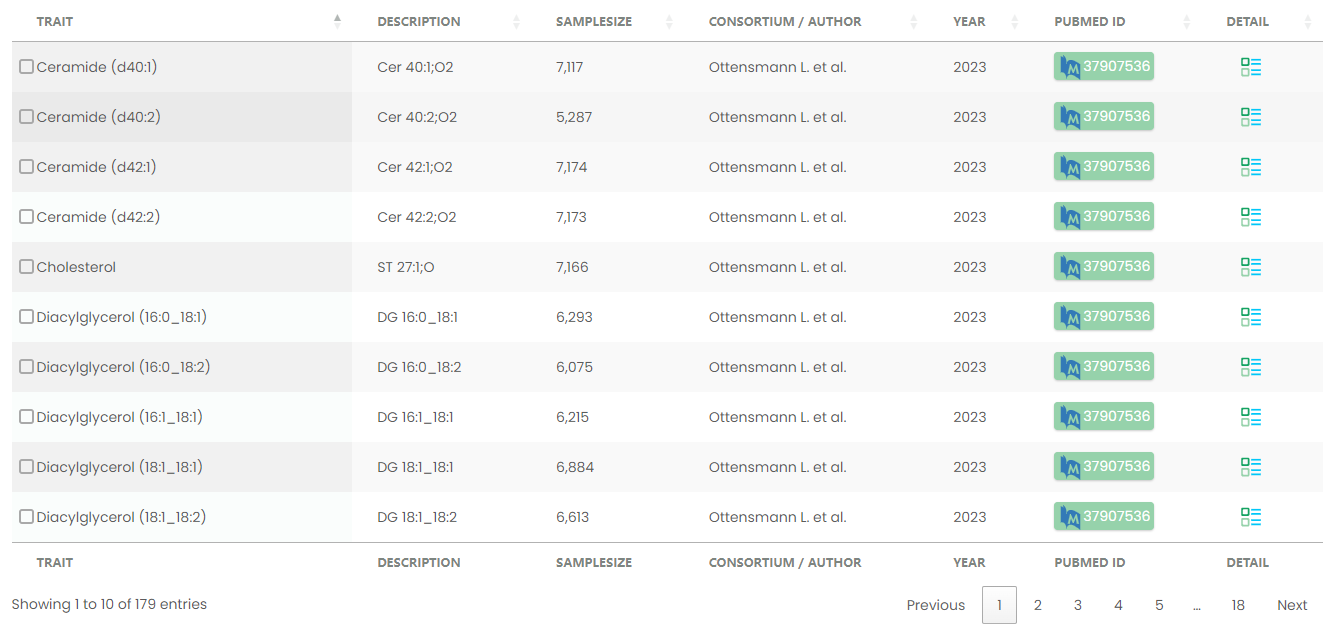
Figure 11-1
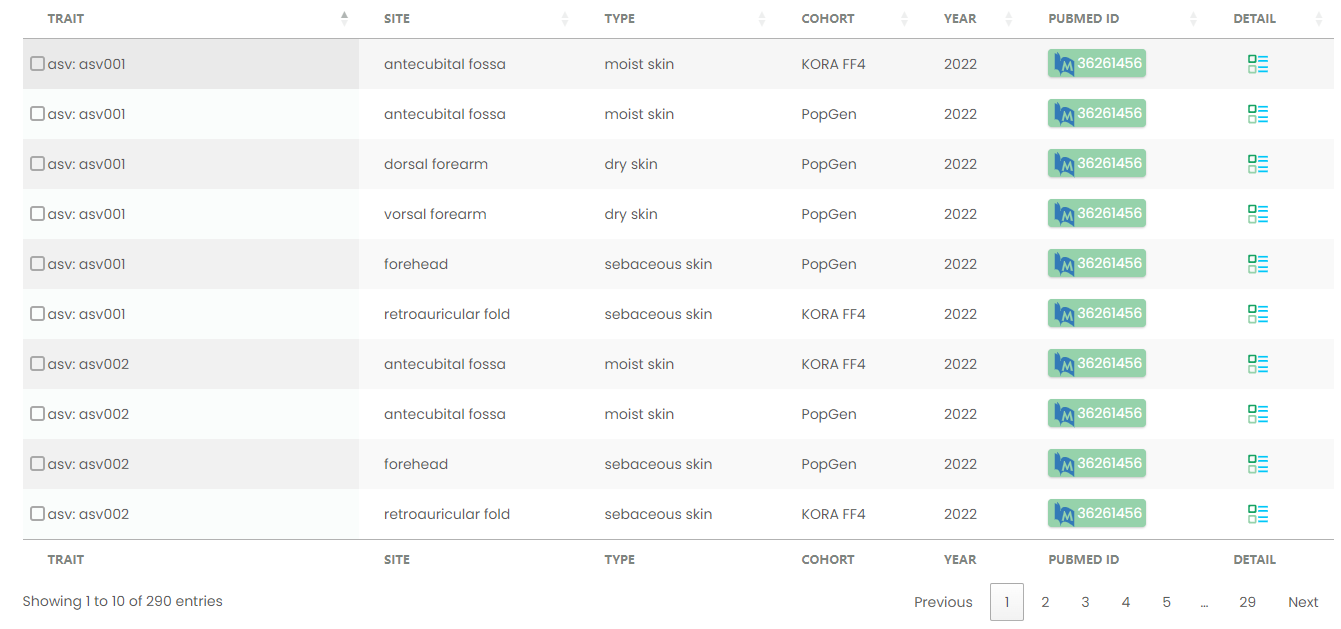
Figure 12-1
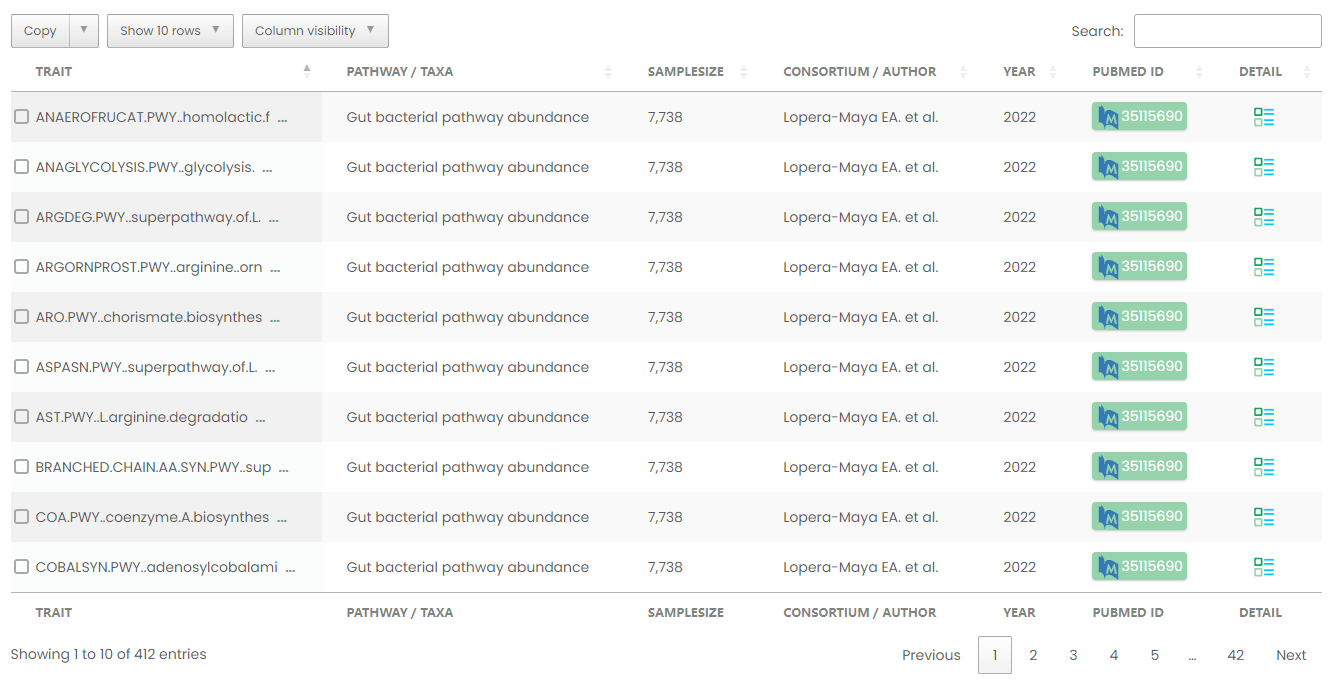
Figure 13-1
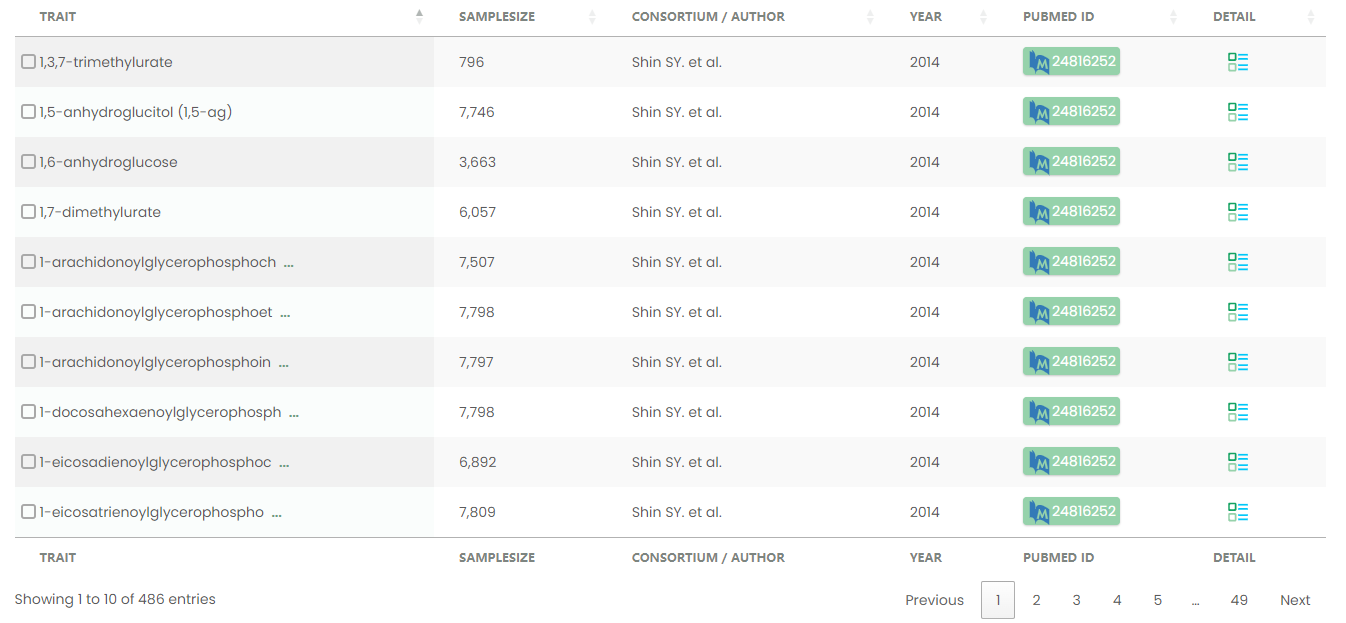
Figure 14-1
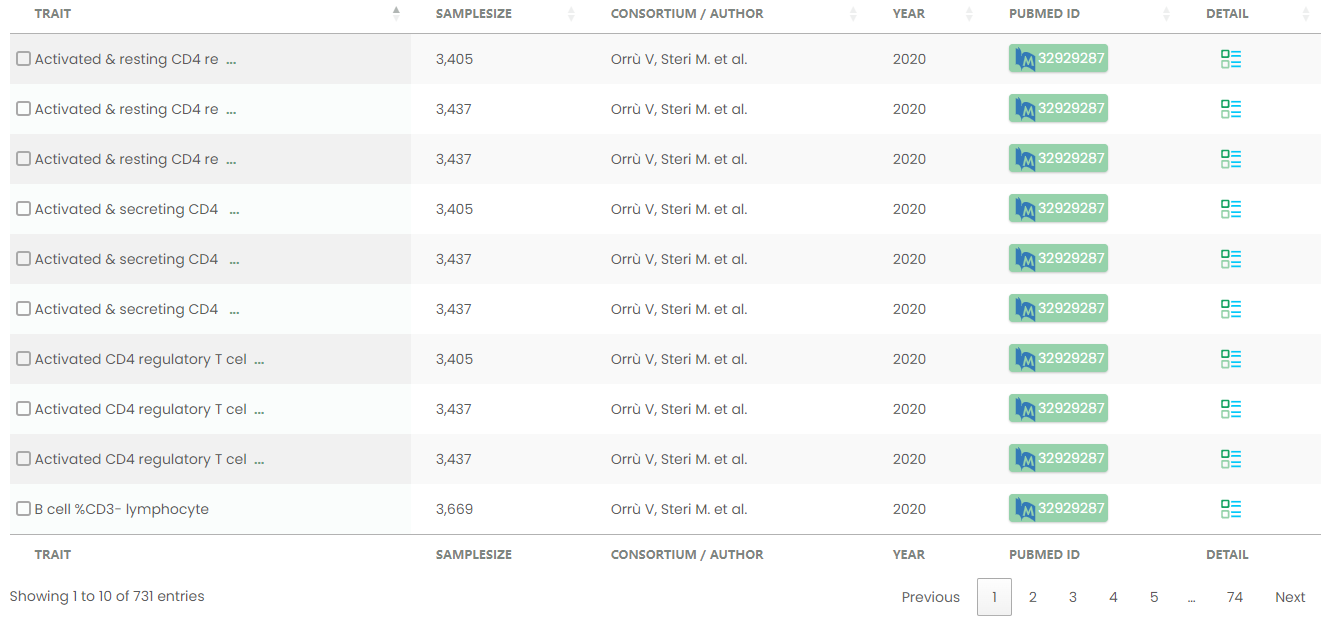
Figure 15-1
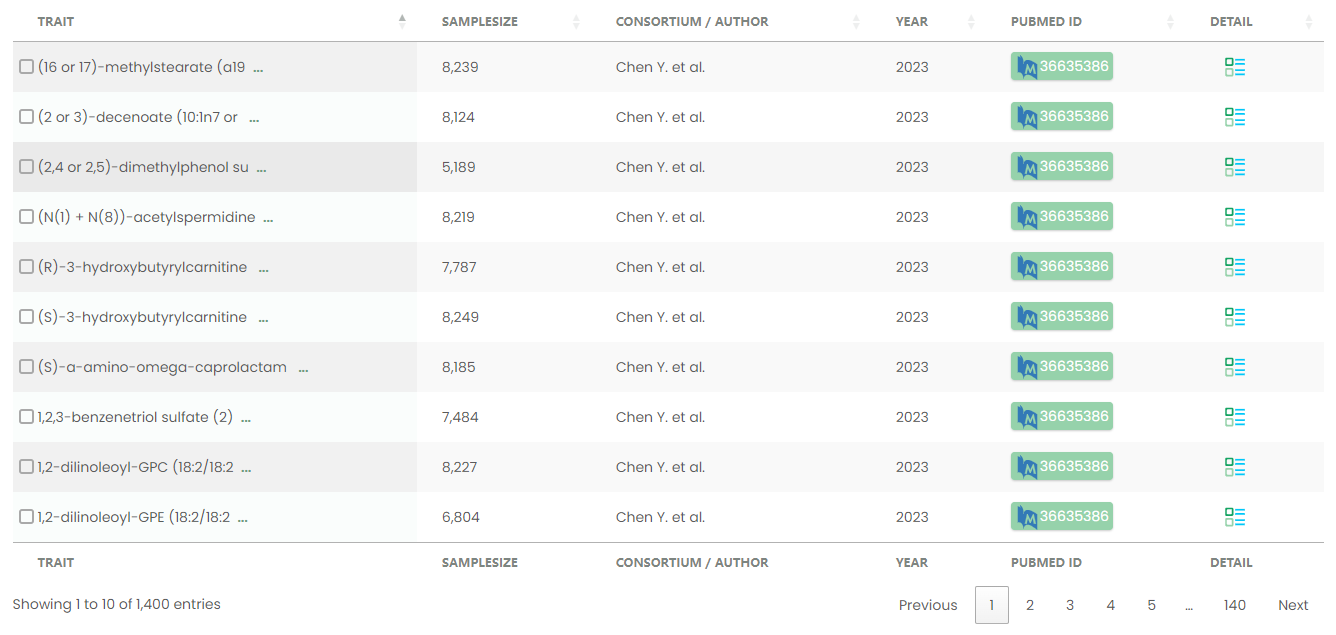
Figure 16-1
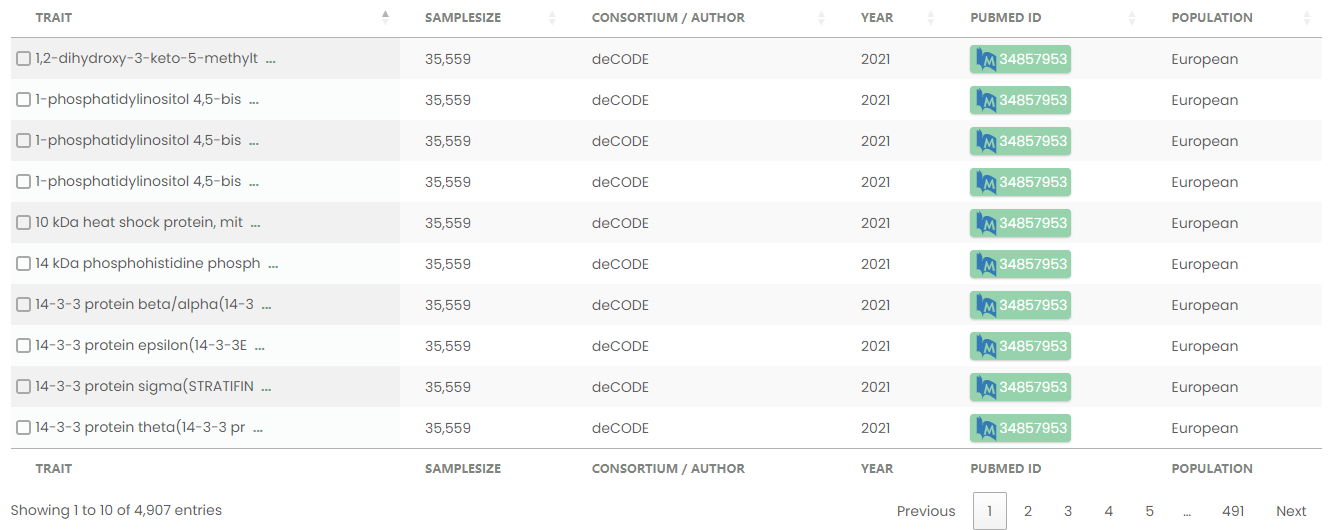
Figure 17-1
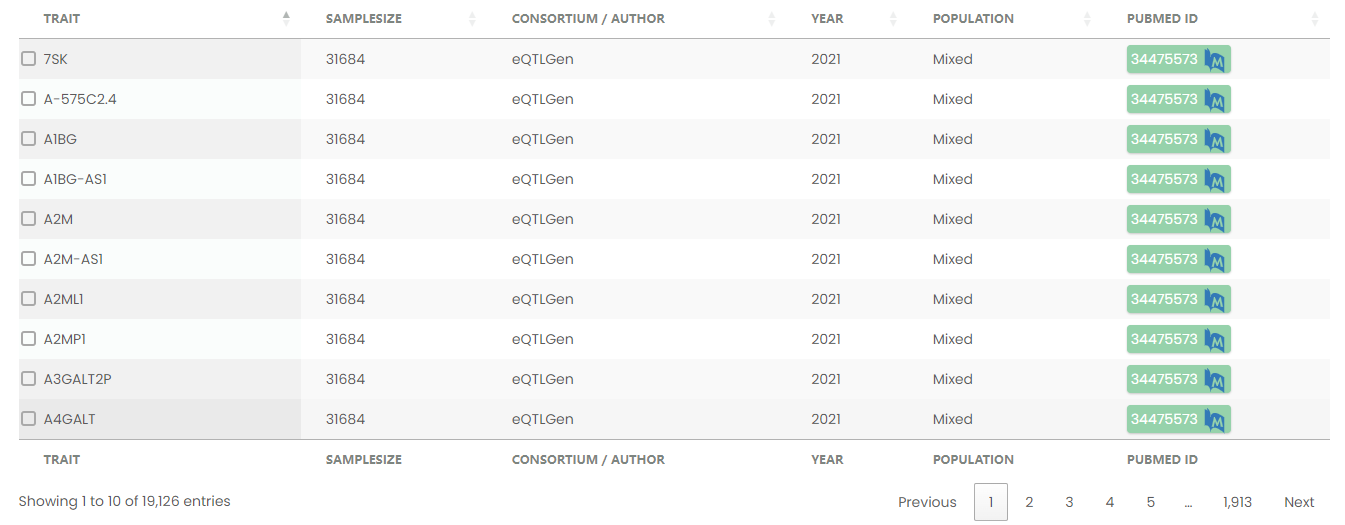
Figure 18-1