
We are the agency who always gives you a priority on the free of question and you can easily make a question on the bunch.
E xosomes are a nano-sized vesicle structure derived from cells, which can be derived from normal cells and tumor cells of the body, and are distributed in various body fluids such as blood, saliva, urine, breast milk and so on. It contain an abundant product of different RNA species that can regulate the behavior of recipient cells and can be used as circulating biomarkers for diseases. In recent years, due to the constant understanding and study of exosomes, research on exosomes has become a hot spot. Therefore, the collection of exosome data will be crucial for its next research, prevention and diagnosis.In this study, we established ExMdb, a manually curated database which aims at providing data support for the study of exosome RNA. ExMdb provides a user-friendly interface for convenient browsing, retrieval and downloading of dataset. A submission page is also included to allow researchers to submit newly exosome RNA to cancer data.
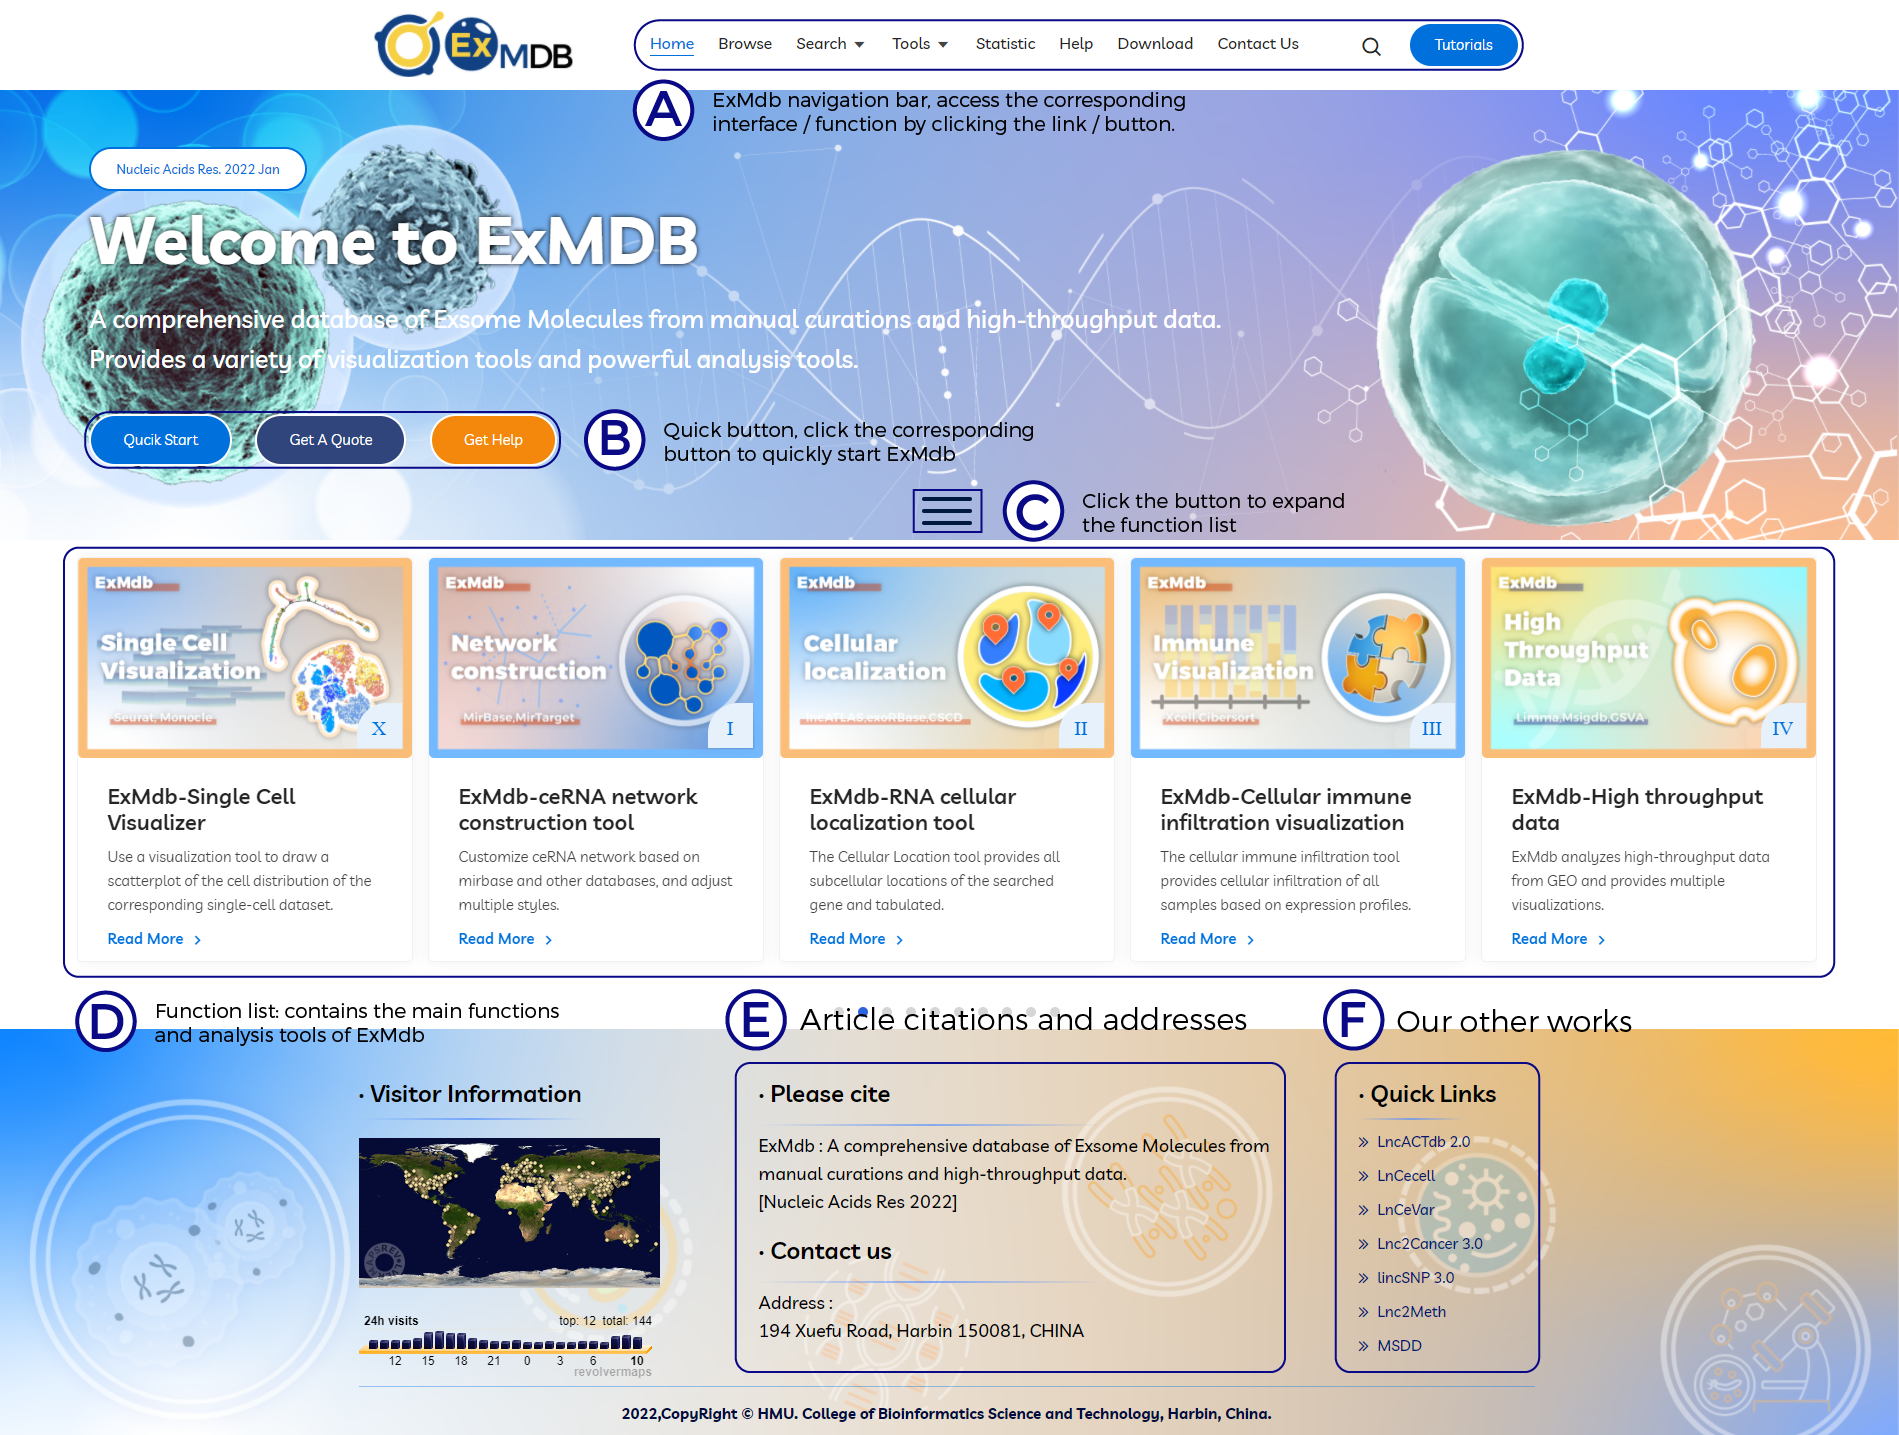
A. ExMdb navigation bar, access the corresponding interface / function by clicking the link / button.
B. Quick button, click the corresponding button to quickly start ExMdb.
C. Click the button to expand the function list.
D. Function list: contains the main functions and analysis tools of ExMdb.
E. Article citations and addresses.
F. Our other works.
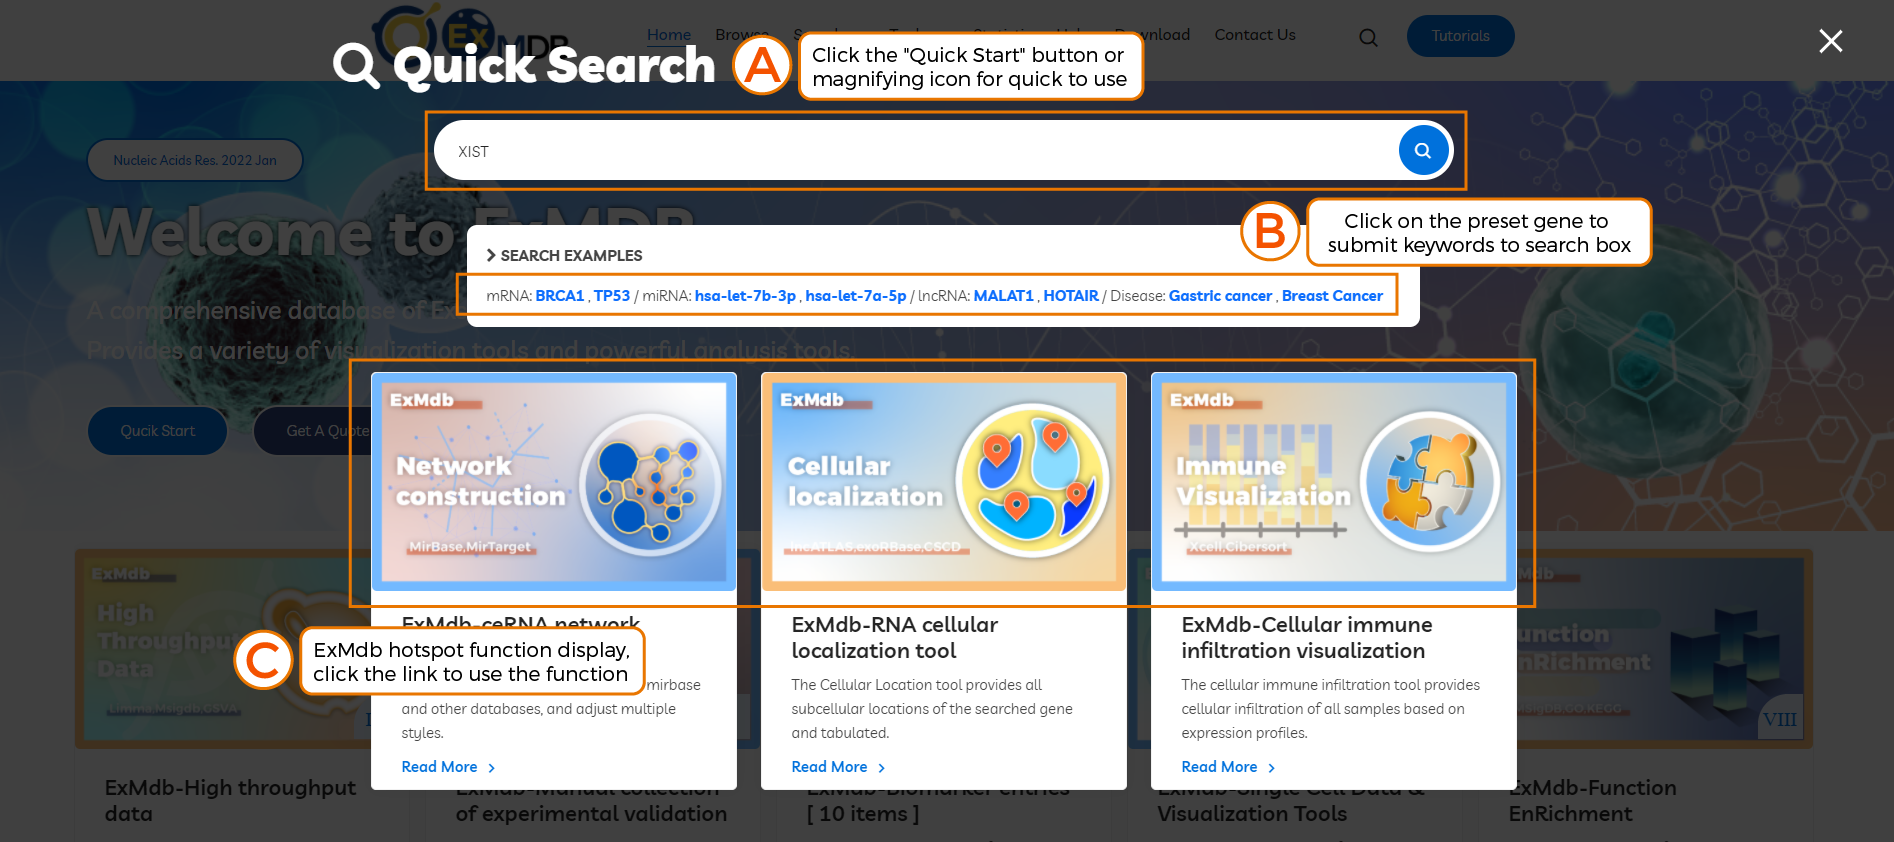
A. Click the "Quick Start" button or magnifying icon for quick to use.
B. Click on the preset gene to submit keywords to search box.
C. ExMdb hotspot function display, click the link to use the function.
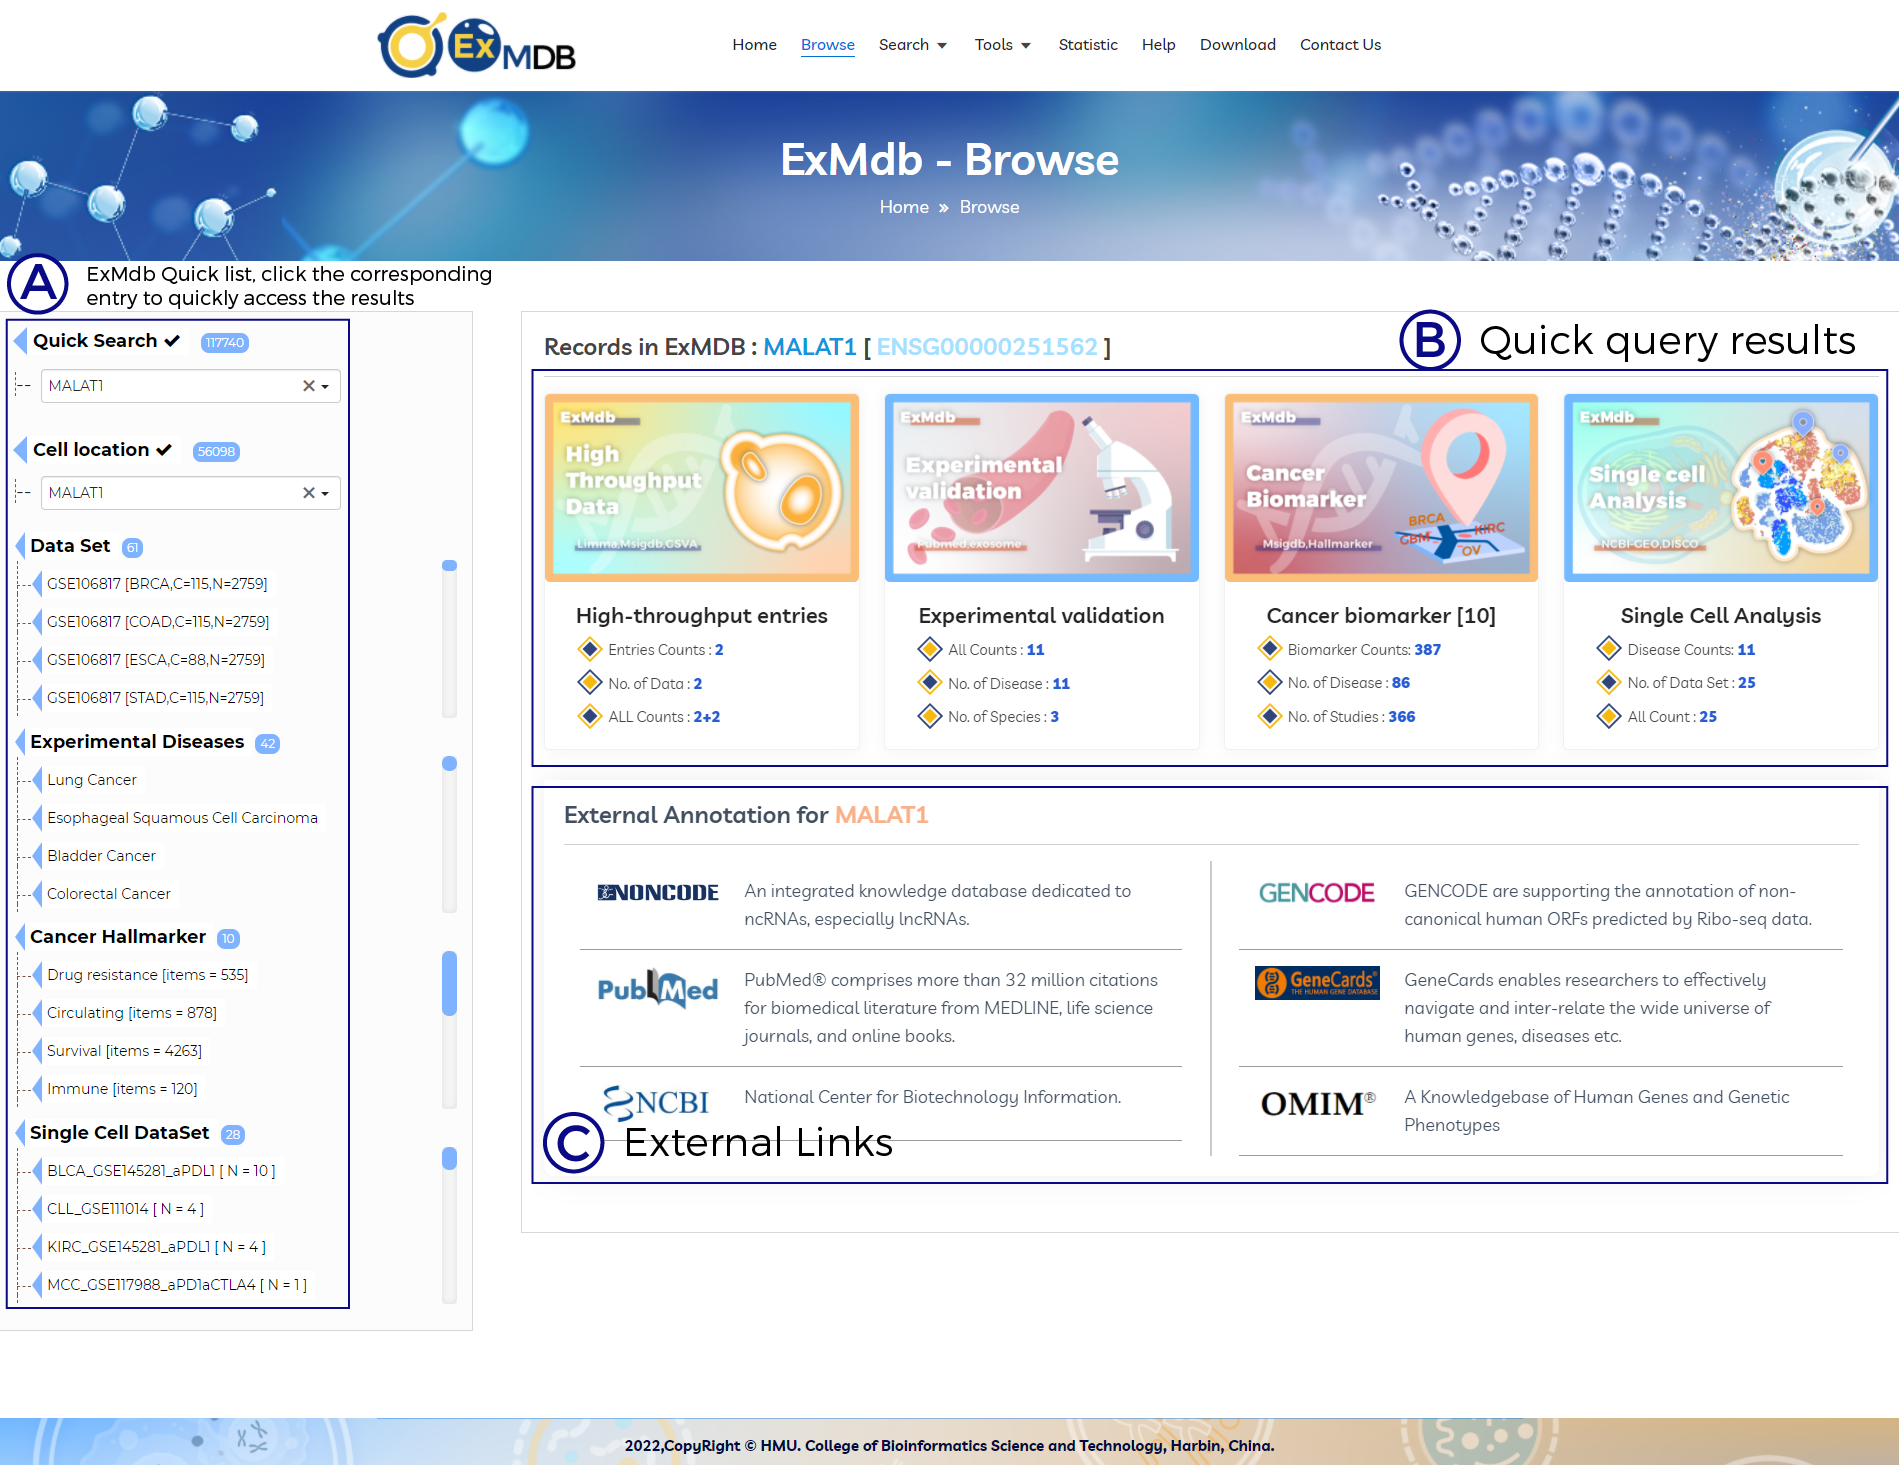
A. ExMdb Quick list, click the corresponding entry to quickly access the results.
B. Quick query results.
C. External Links.
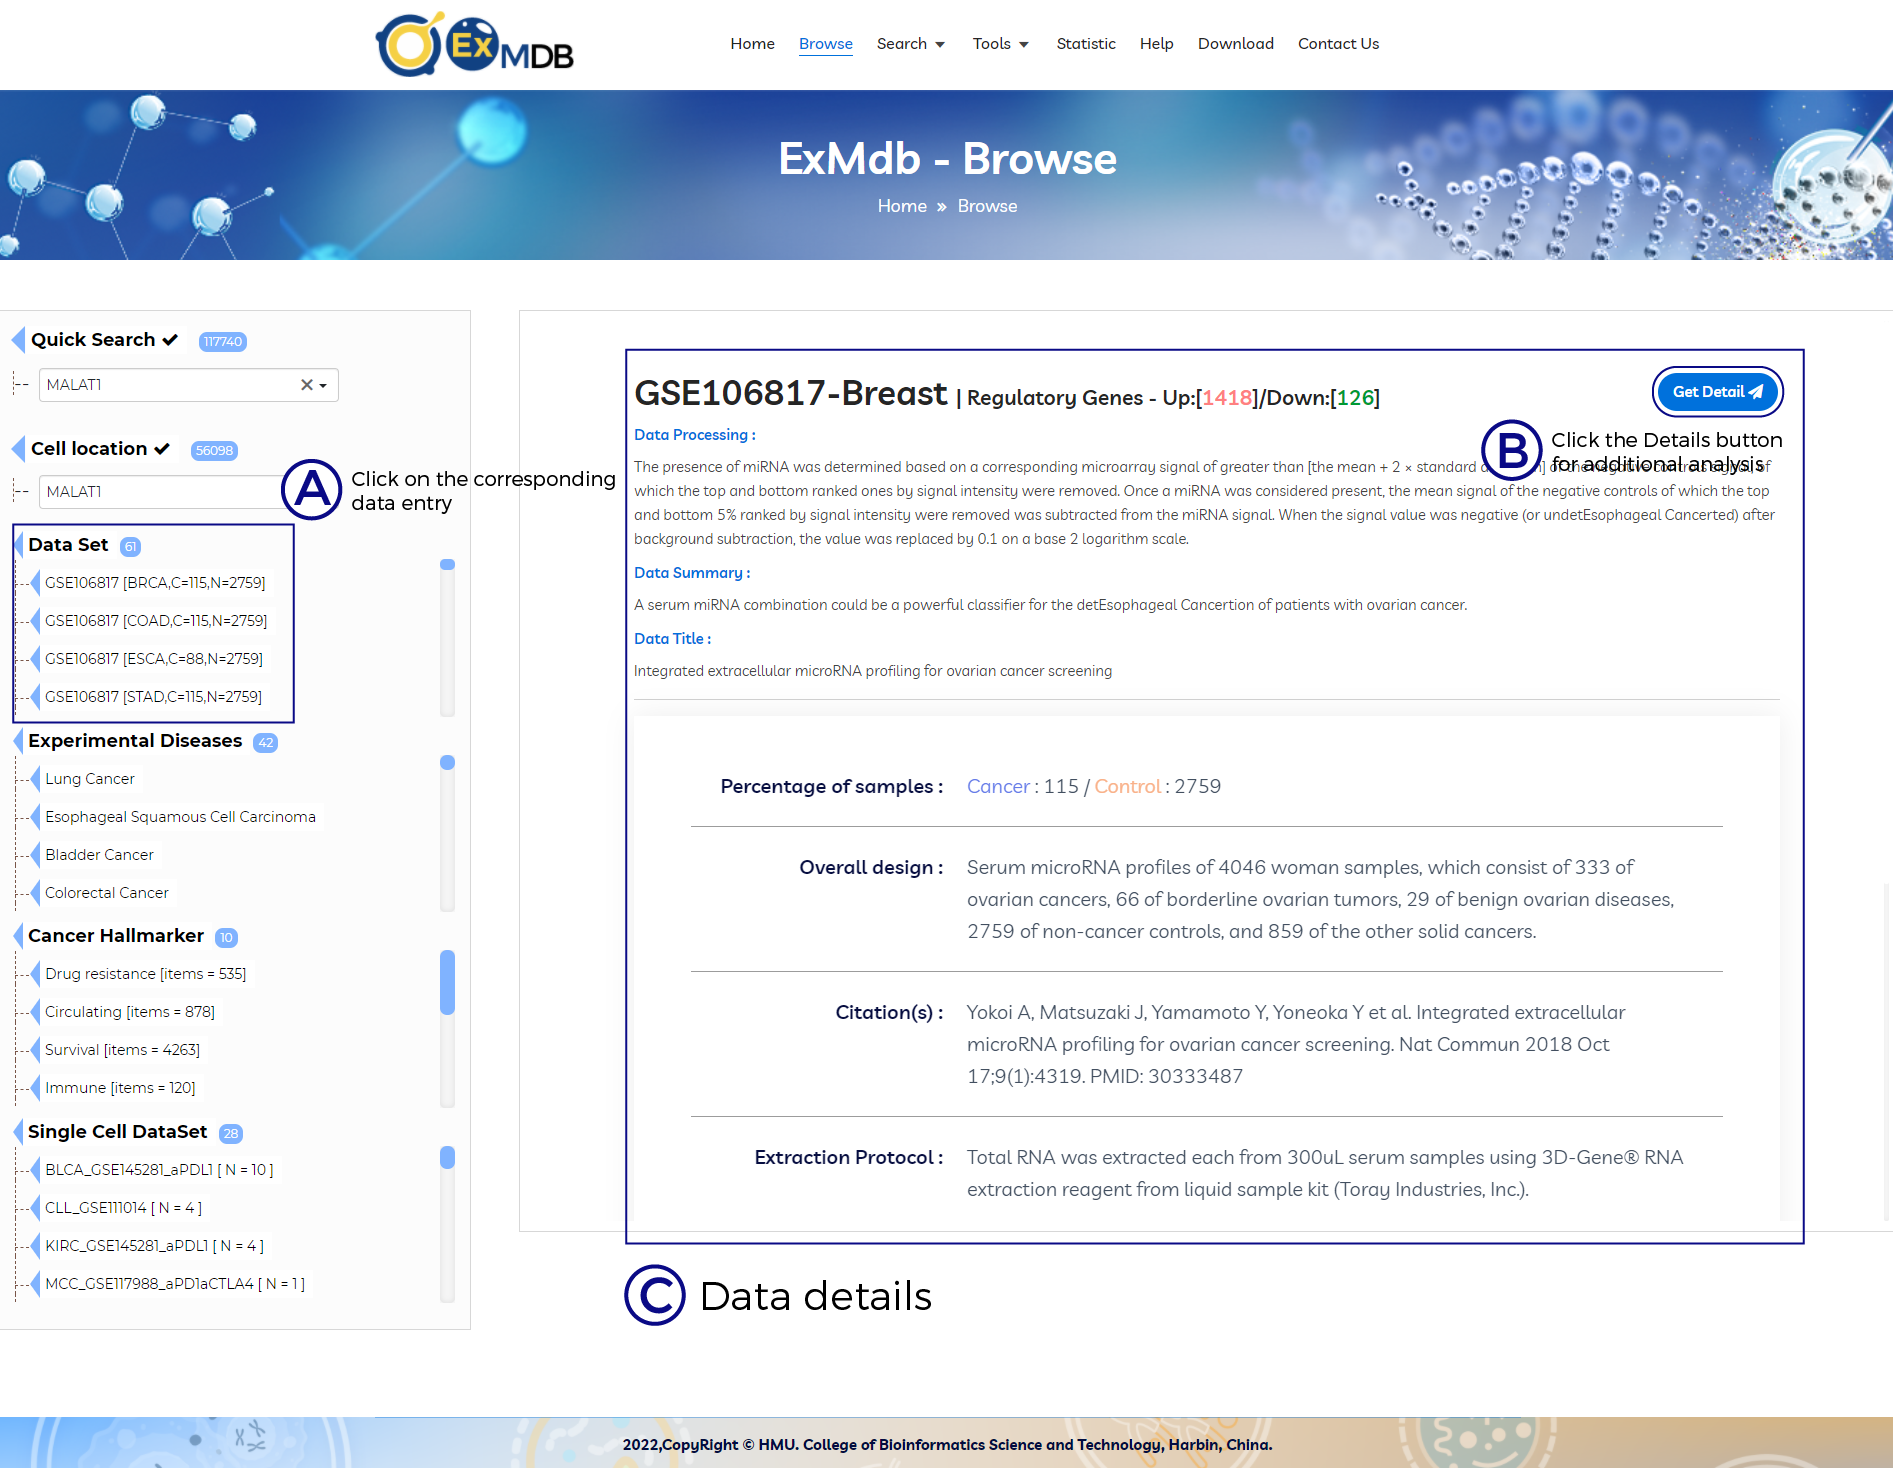
A. Click on the corresponding data entry.
B. Click the Details button for additional analysis.
C. Data details.
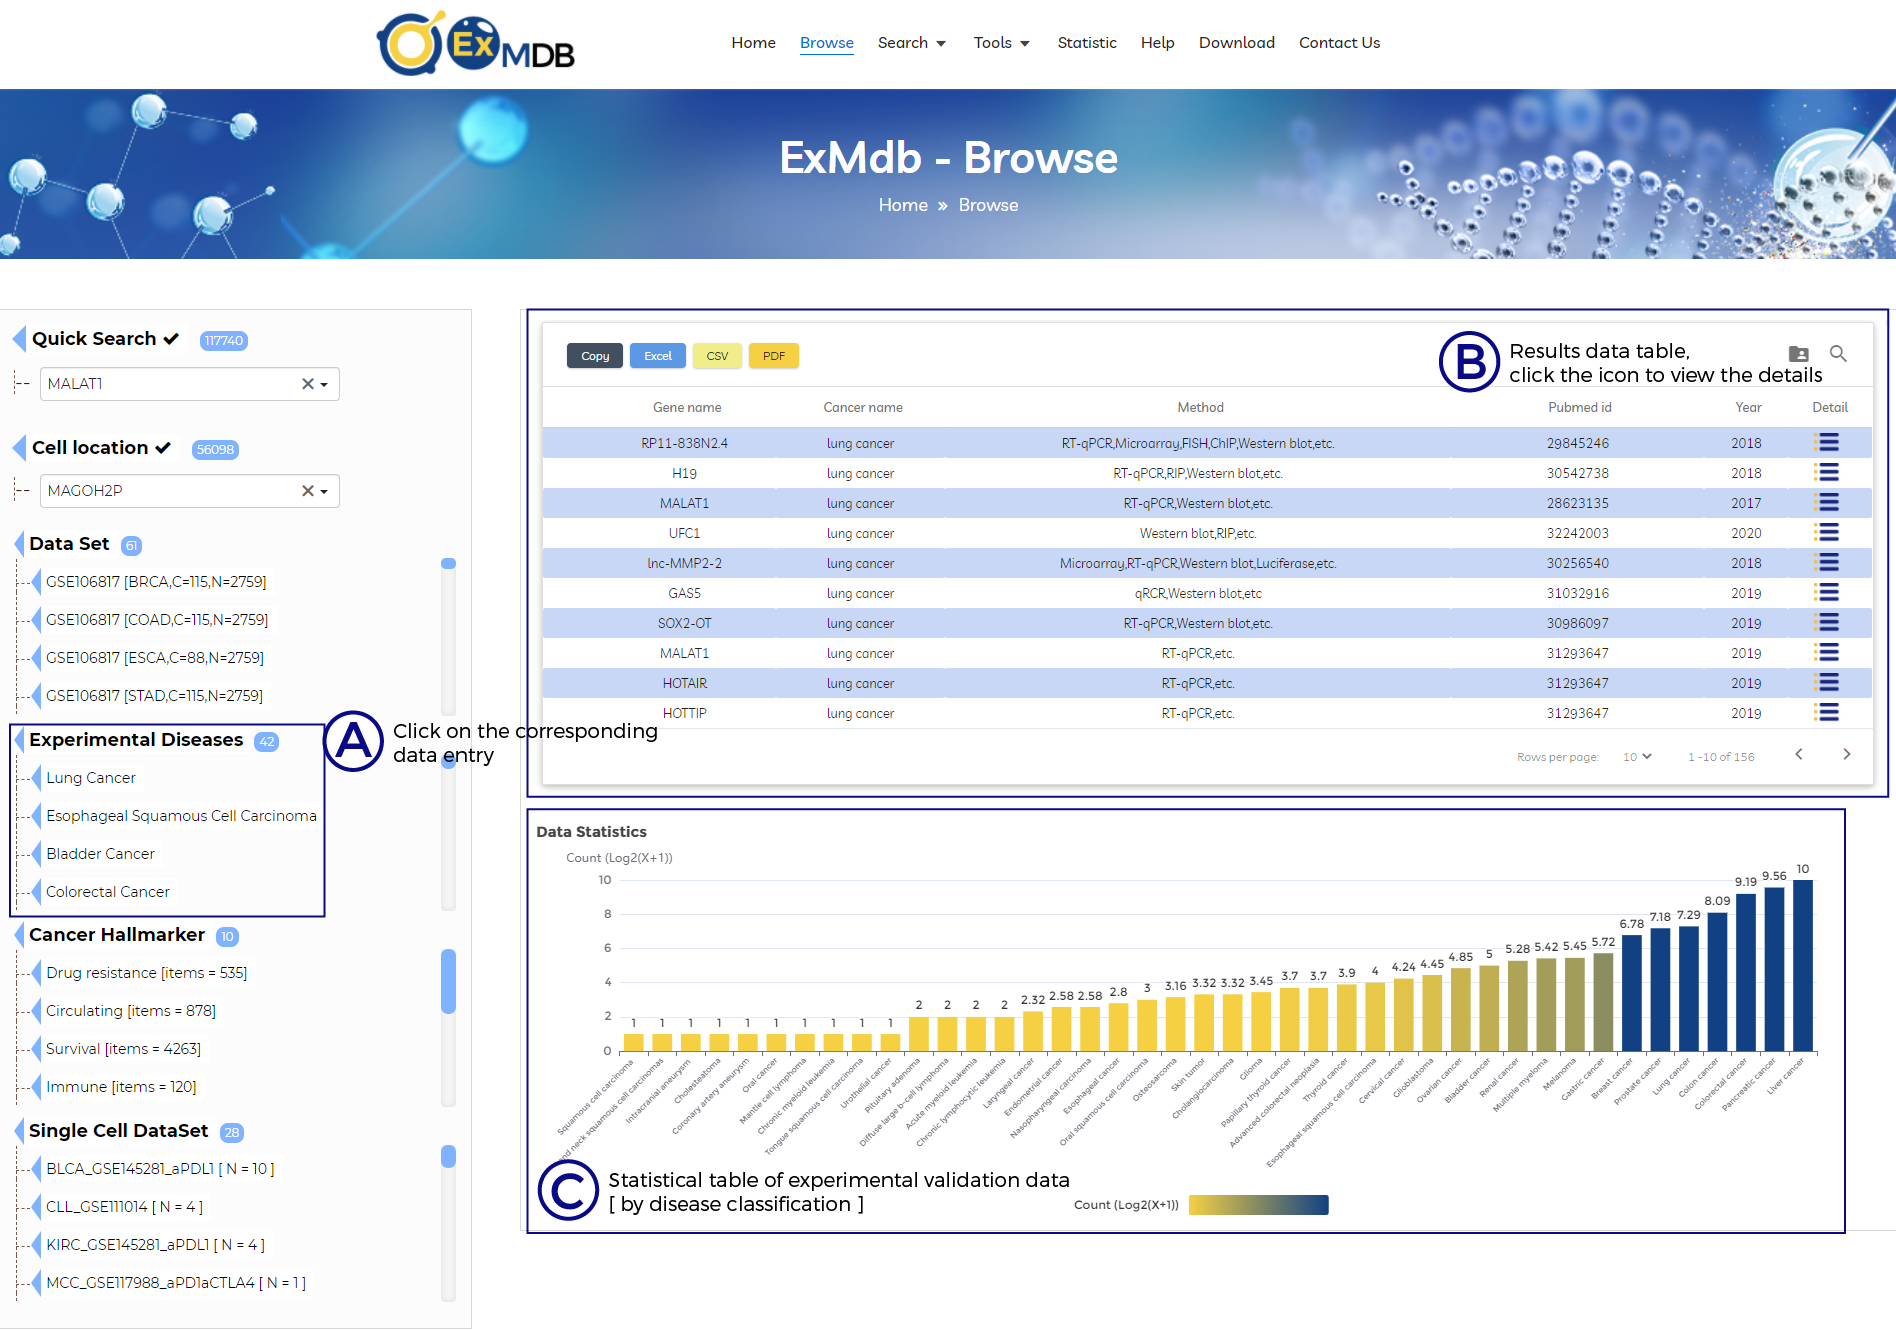
A. Click on the corresponding data entry.
B. Results data table, click the icon to view the details.
C. Statistical table of experimental validation data [ by disease classification ].
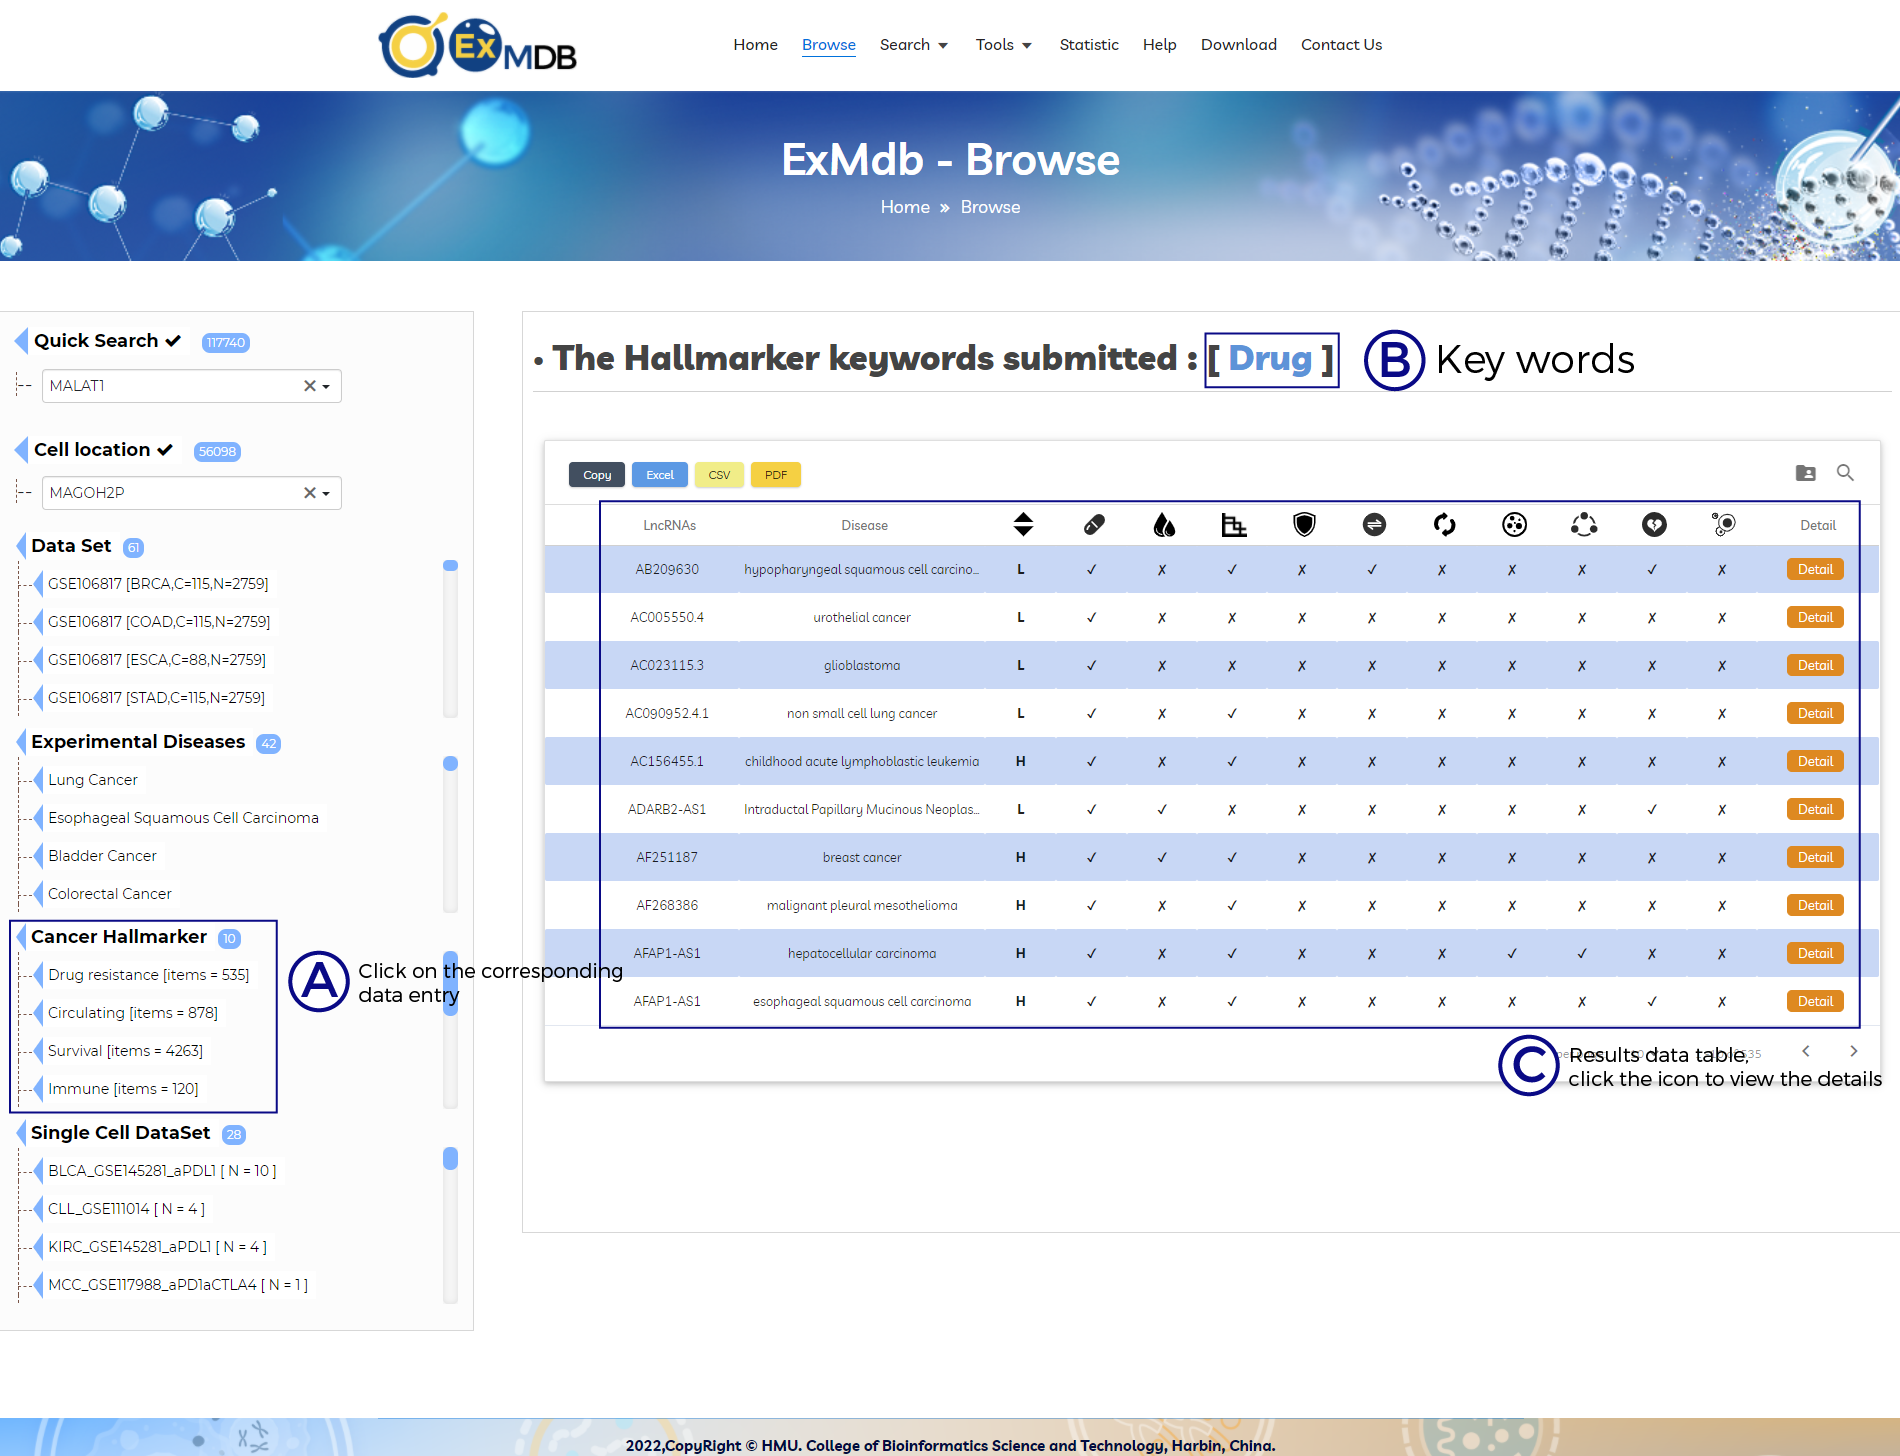
A. ExMdb Quick list, click the corresponding entry to quickly access the results.
B. Key words.
C. Results data table, click the icon to view the details.
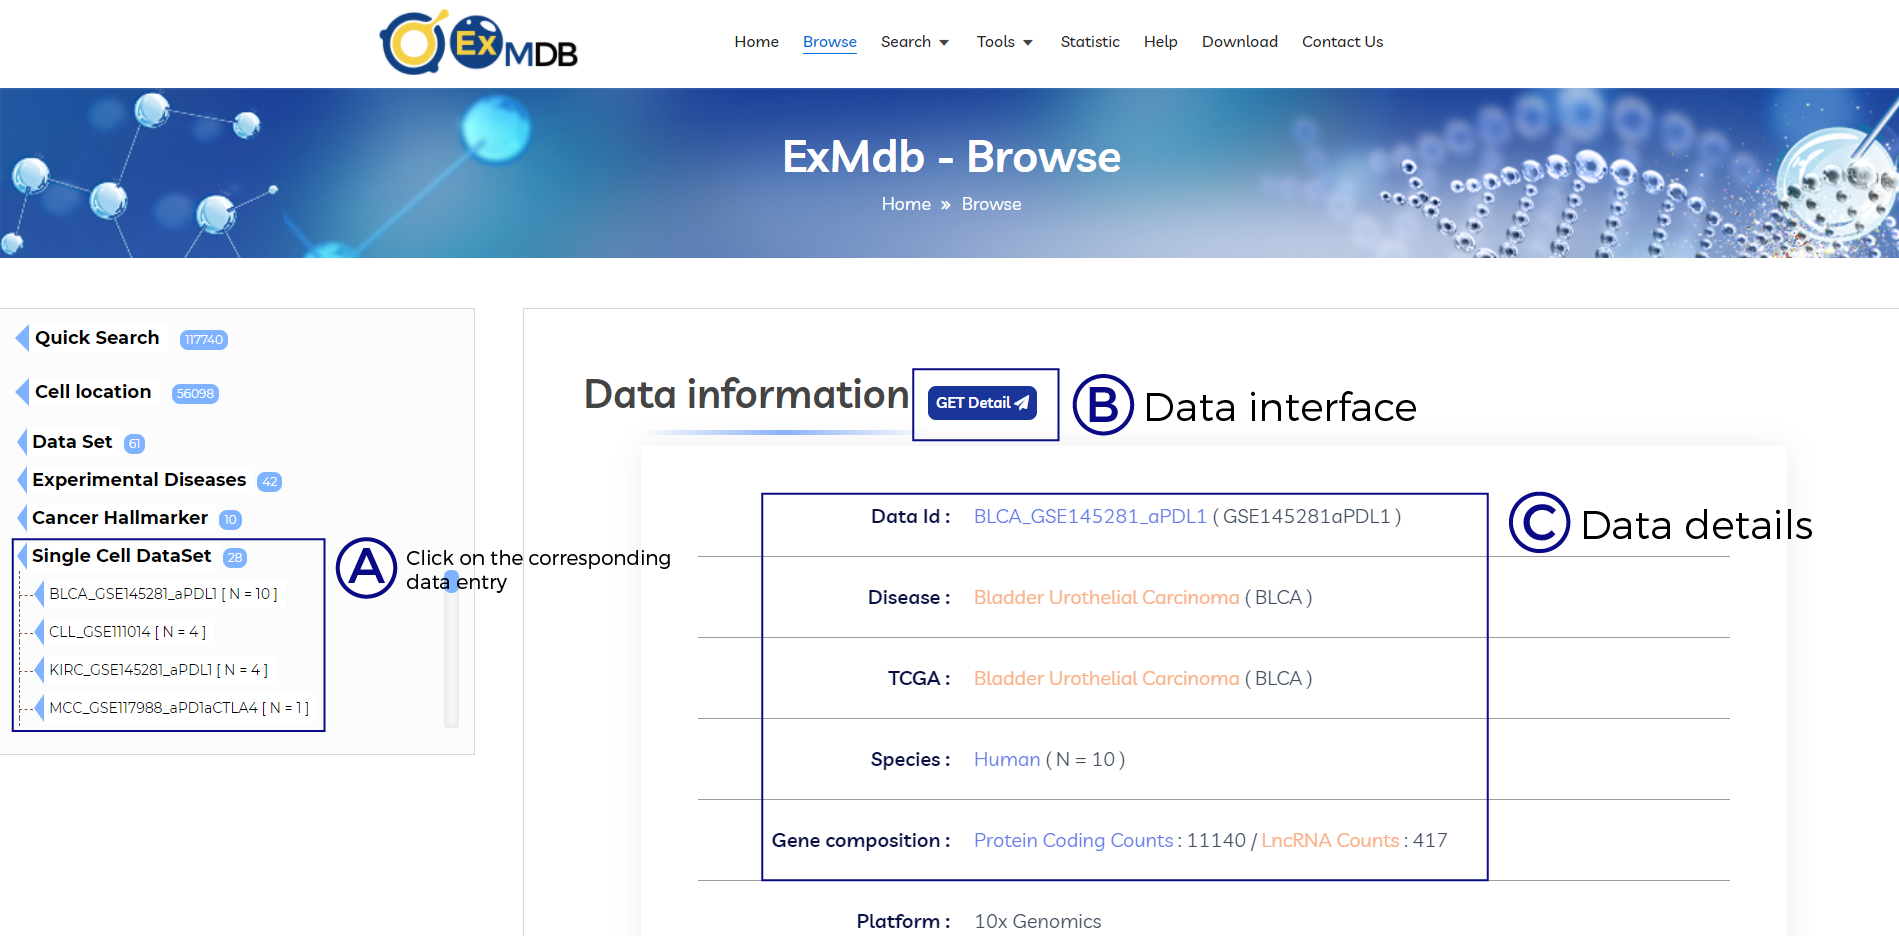
A. Click on the corresponding data entry.
B. Data interface.
C. Data details.
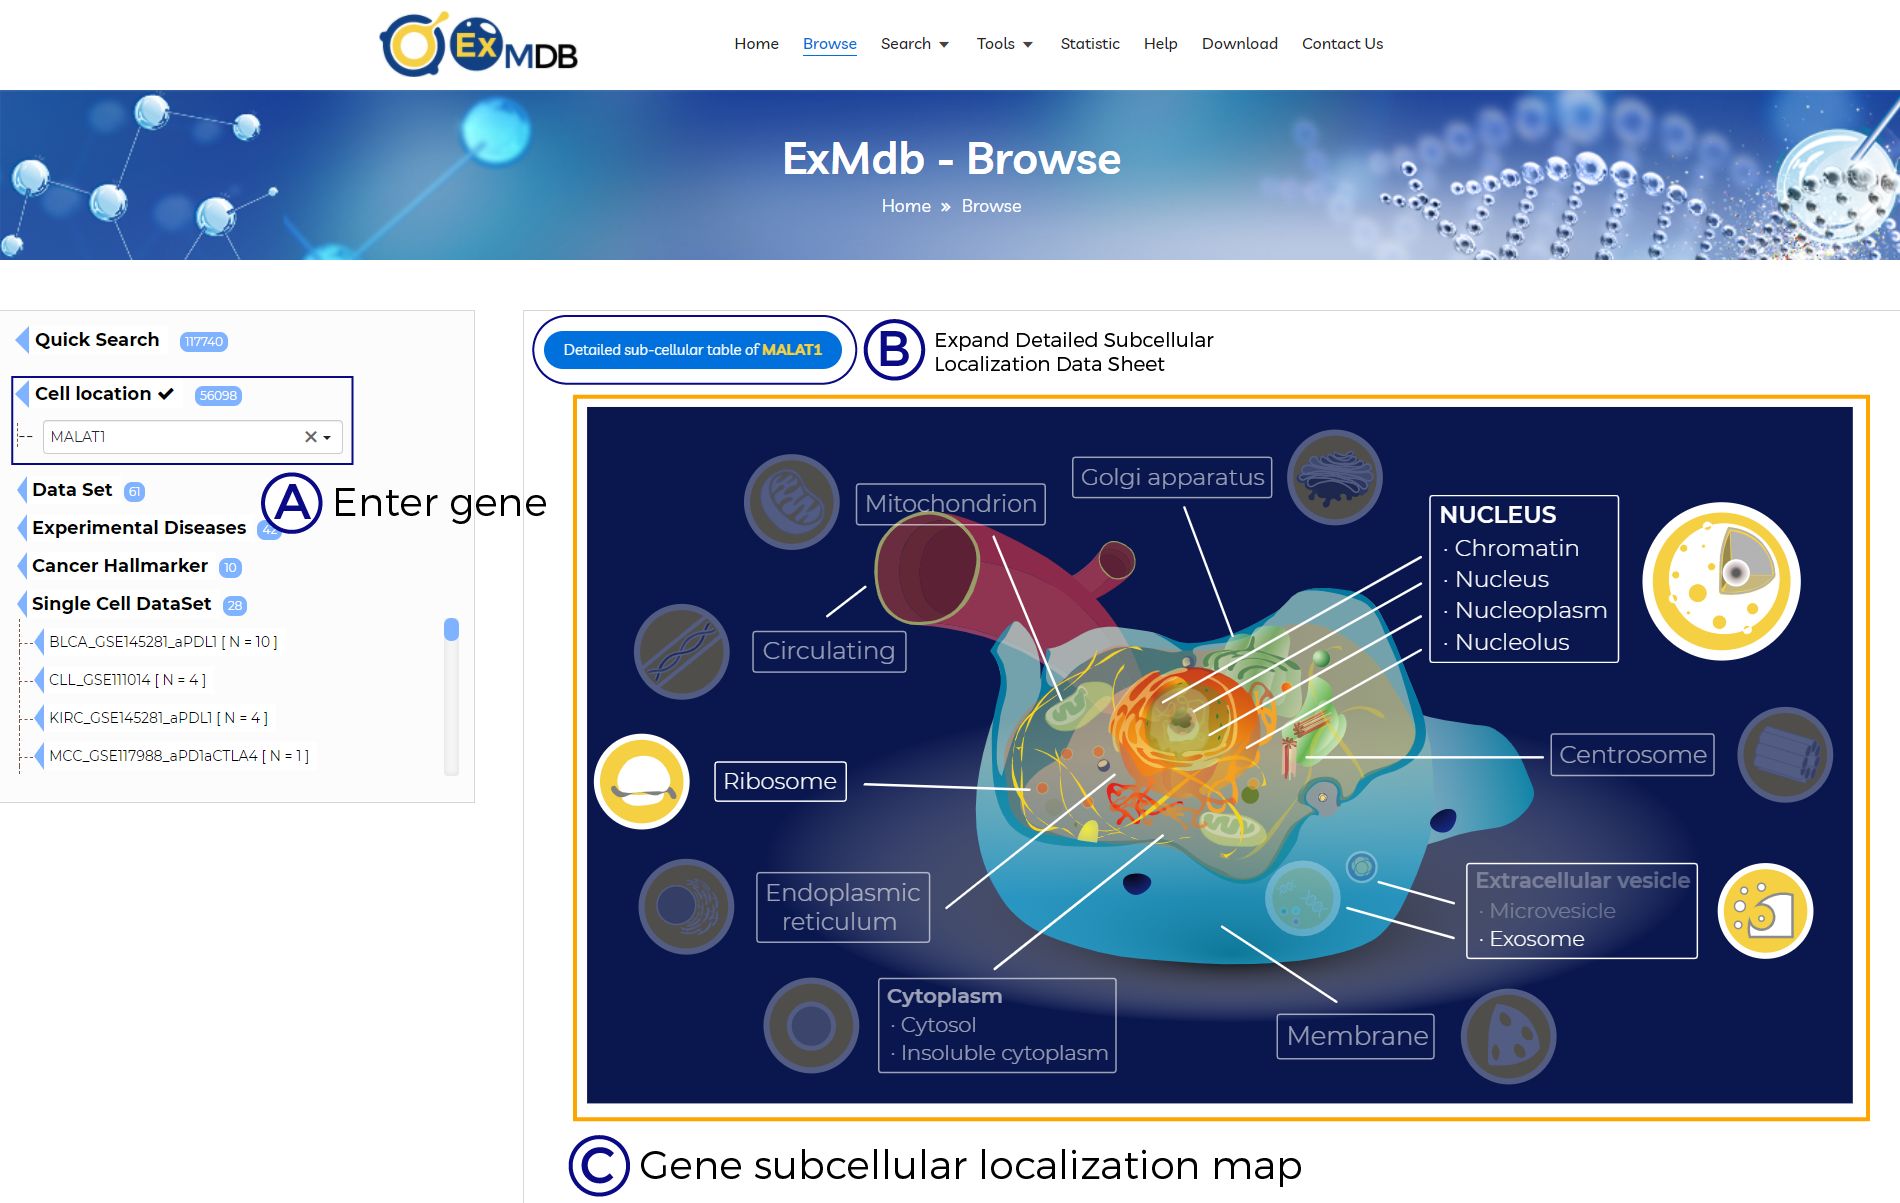
A. Enter gene.
B. Expand Detailed Subcellular Localization Data Sheet.
C. Gene subcellular localization map.
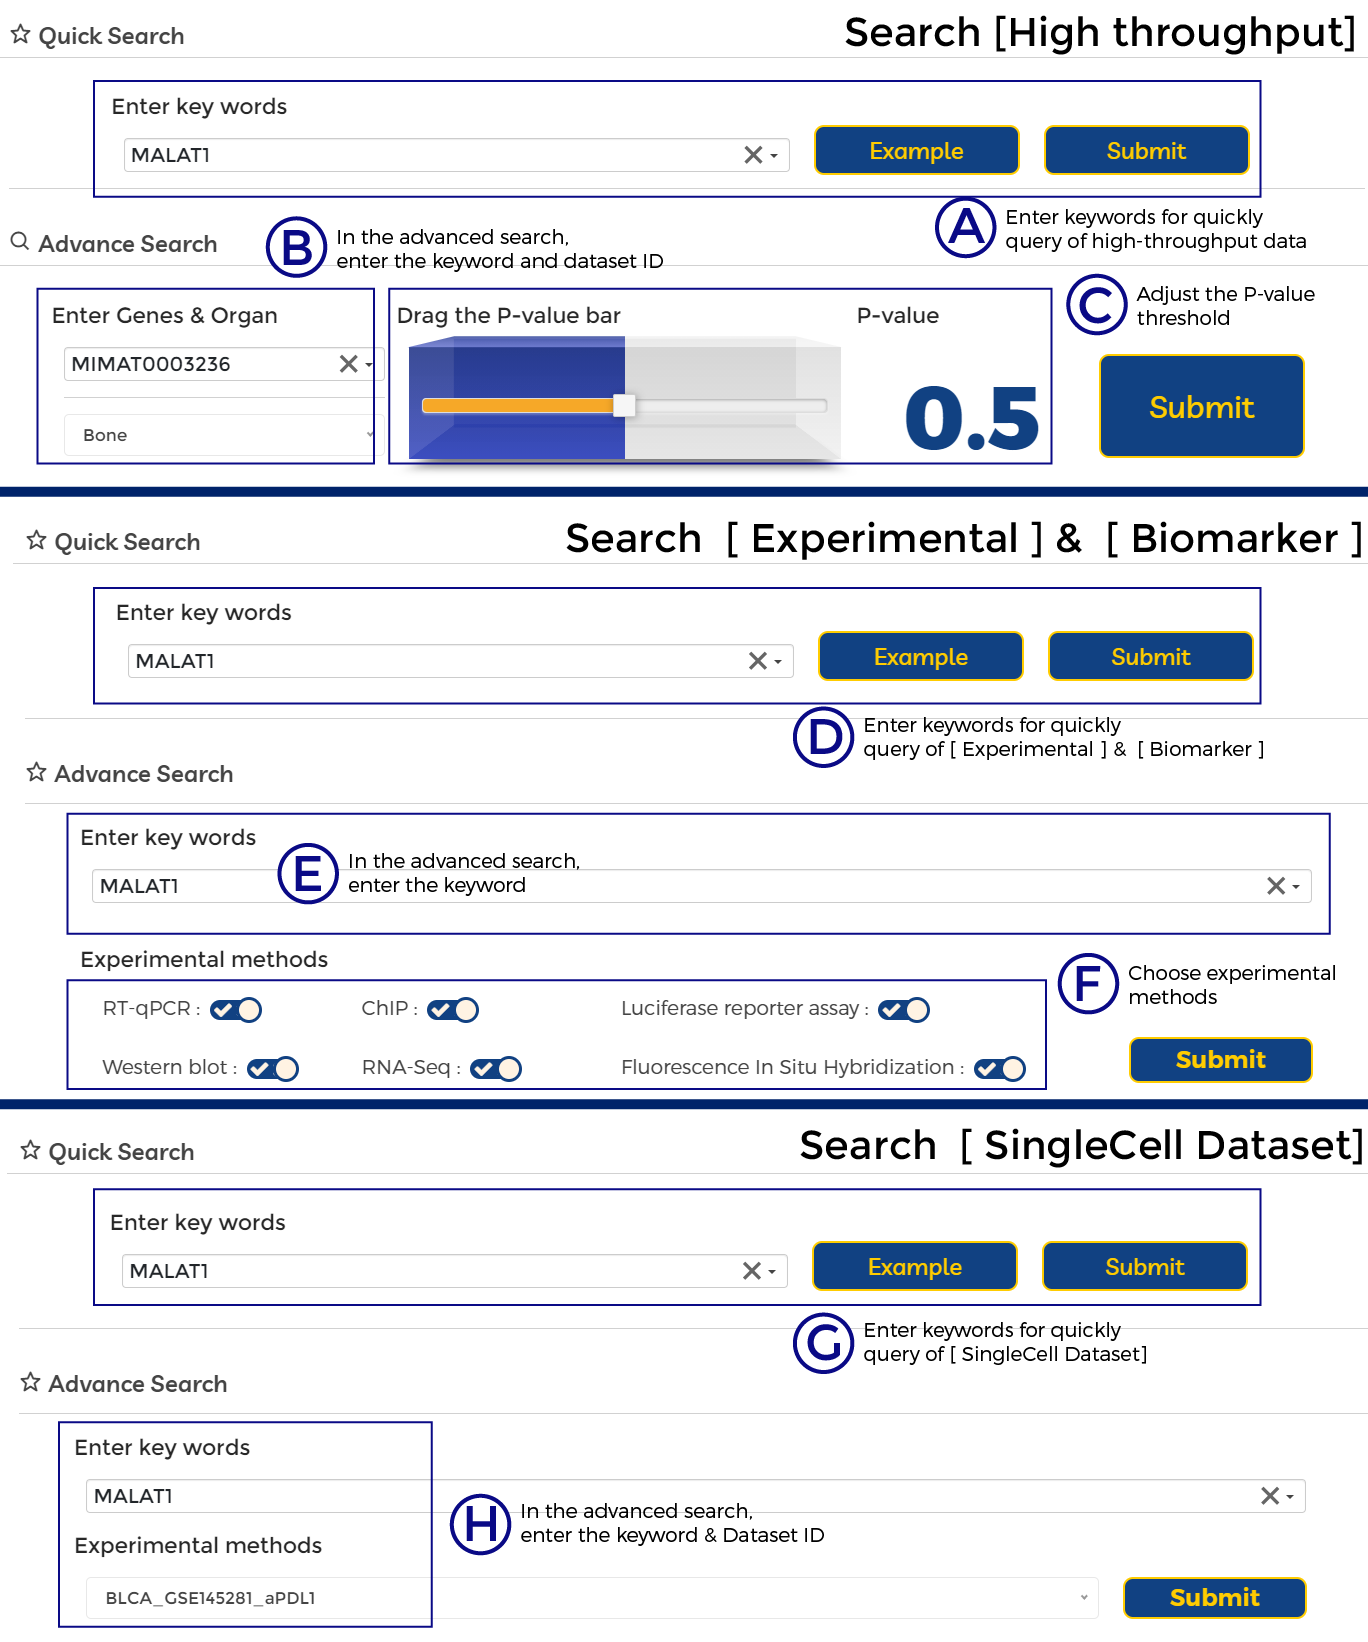
A. Enter keywords for quickly query of high-throughput data.
B. In the advanced search, enter the keyword and dataset ID.
C. Adjust the P-value threshold.
D. Enter keywords for quickly query of [ Experimental ] & [ Biomarker ].
E. In the advanced search, enter the keyword.
F. Choose experimental methods.
G. Enter keywords for quickly query of [ SingleCell Dataset].
H. In the advanced search, enter the keyword & Dataset ID.
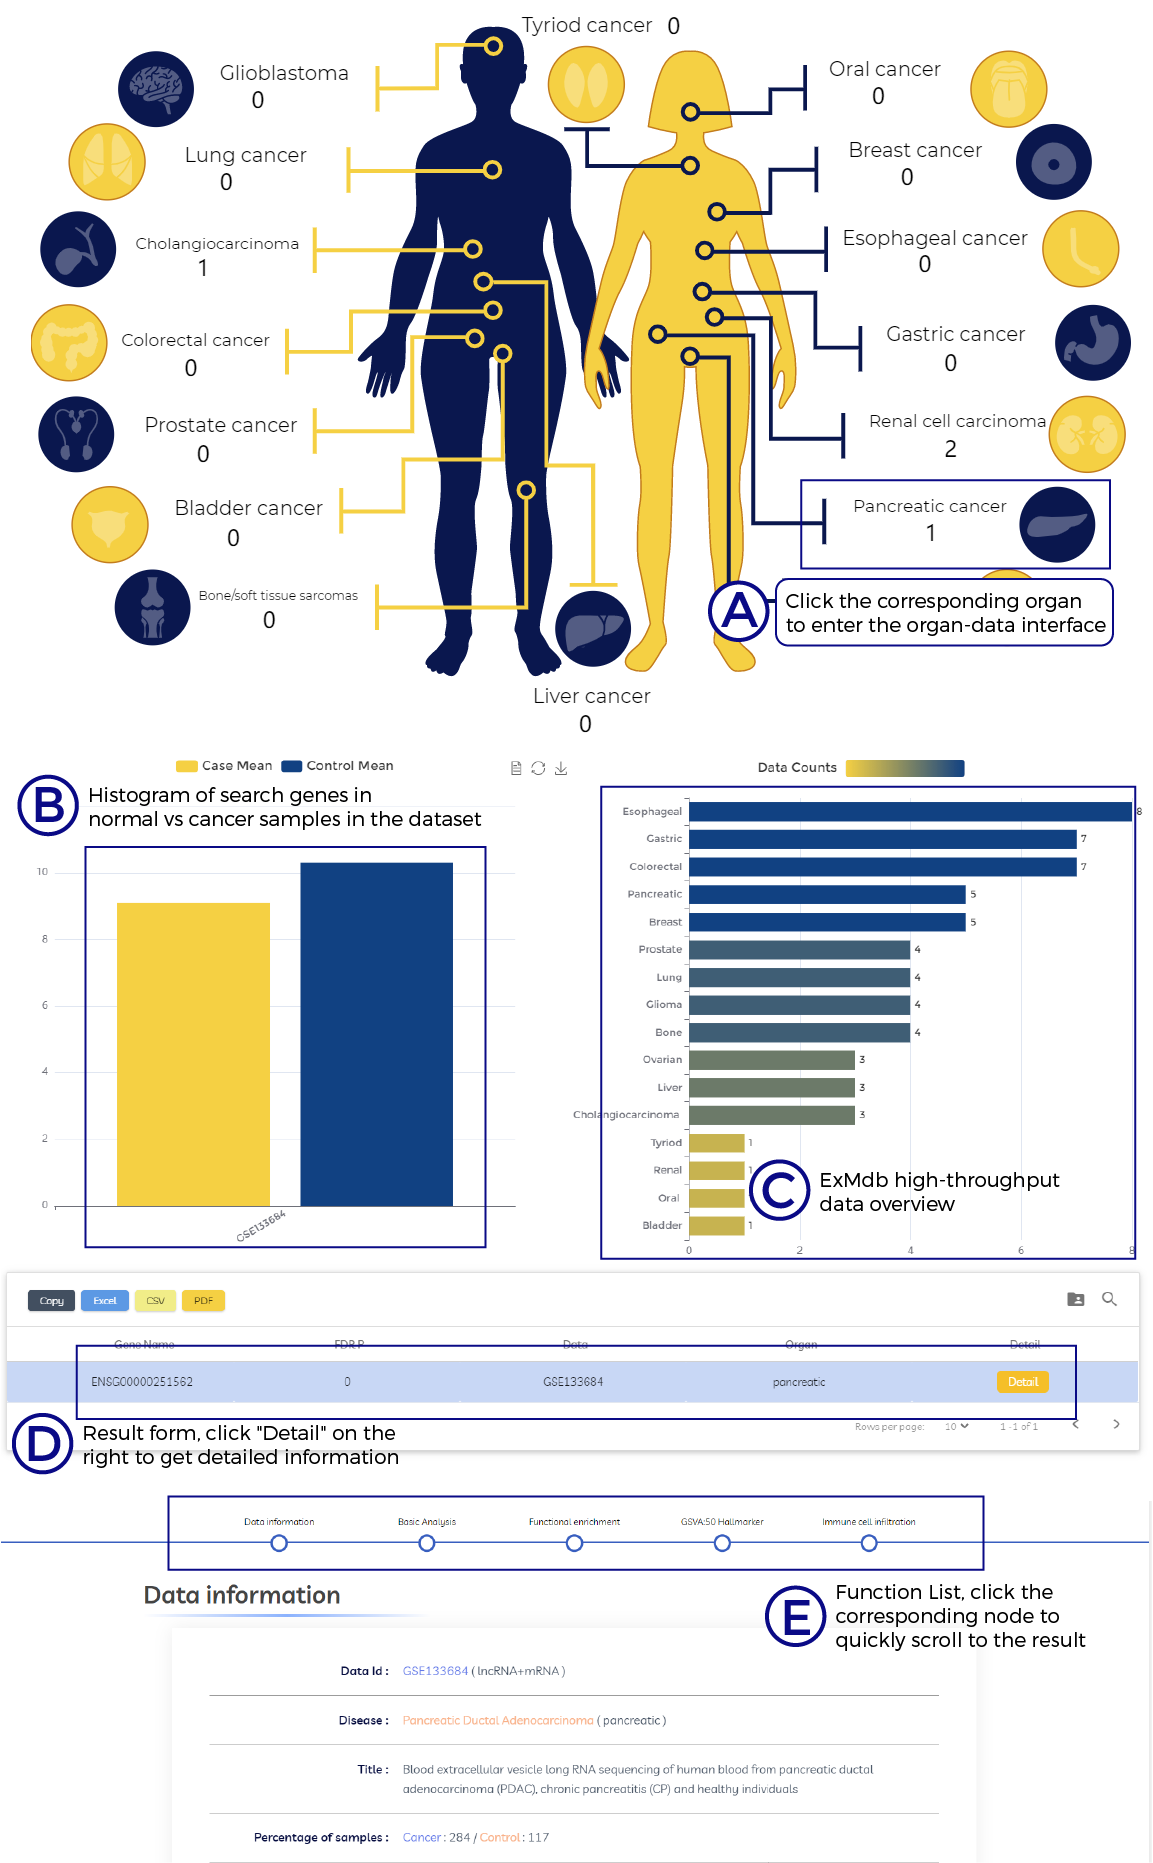
A. Click the corresponding organ to enter the organ-data interface.
B. Histogram of search genes in normal vs cancer samples in the dataset.
C. ExMdb high-throughput data overview.
D. Result form, click "Detail" on the right to get detailed information.
E. Function List, click the corresponding node to quickly scroll to the result

A. Biomarker DataTable.
B. Gene Information [Experimental].
C. Click the "Detail" button for more details.
D. Function List, click the corresponding node to quickly scroll to the result.
E. Biomarker Radar Chart.
F. Detailed data information.
G. Function List, click the corresponding node to quickly scroll to the result.
H. Detailed data information.
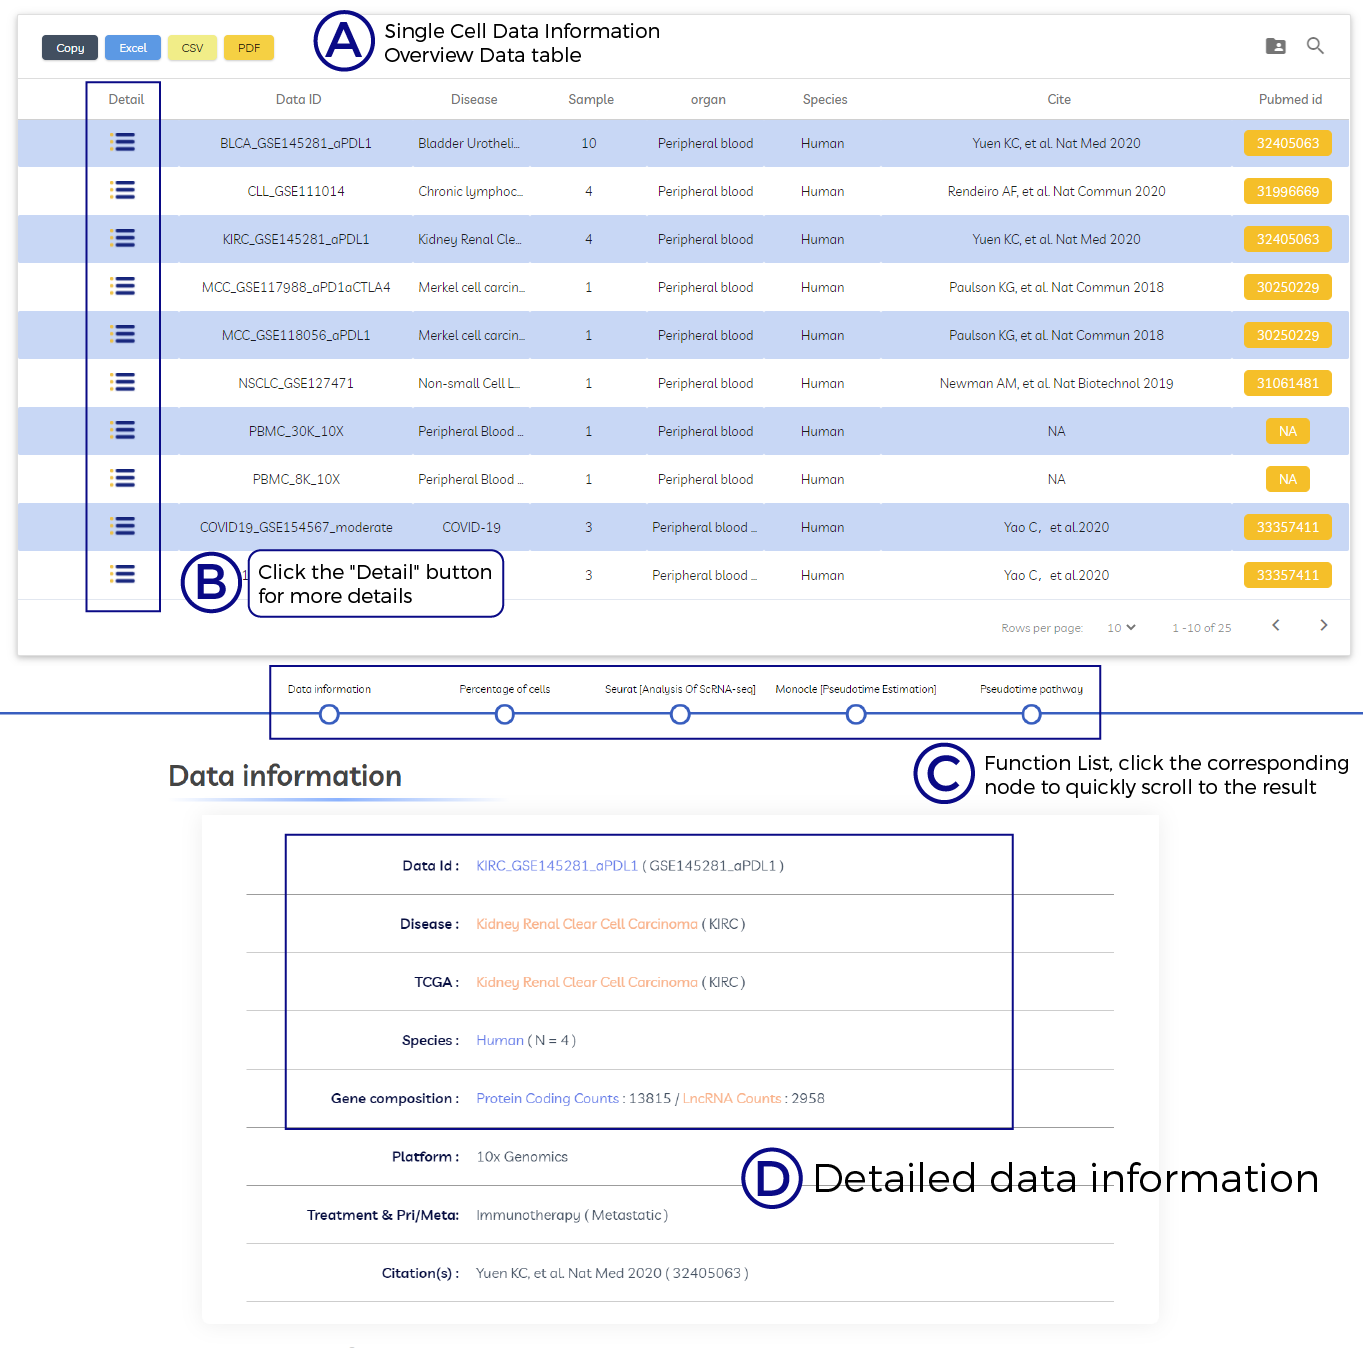
A. Single Cell Data Information Overview Data table.
B. Click the "Detail" button for more details.
C. Function List, click the corresponding node to quickly scroll to the result.
D. Detailed data information.
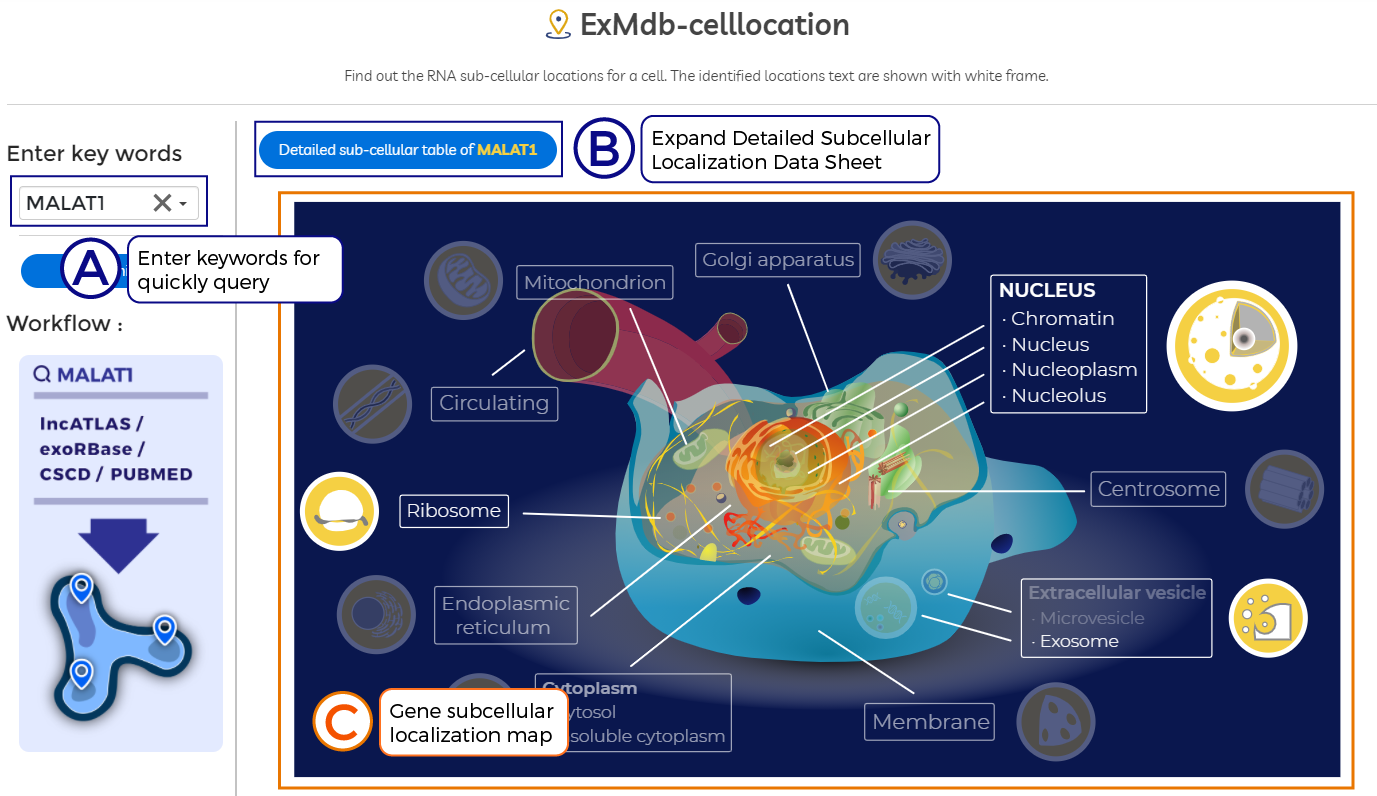
A. Enter keywords for quickly query.
B. Expand Detailed Subcellular Localization Data Sheet.
C. Gene subcellular localization map.
D. Detailed data information.
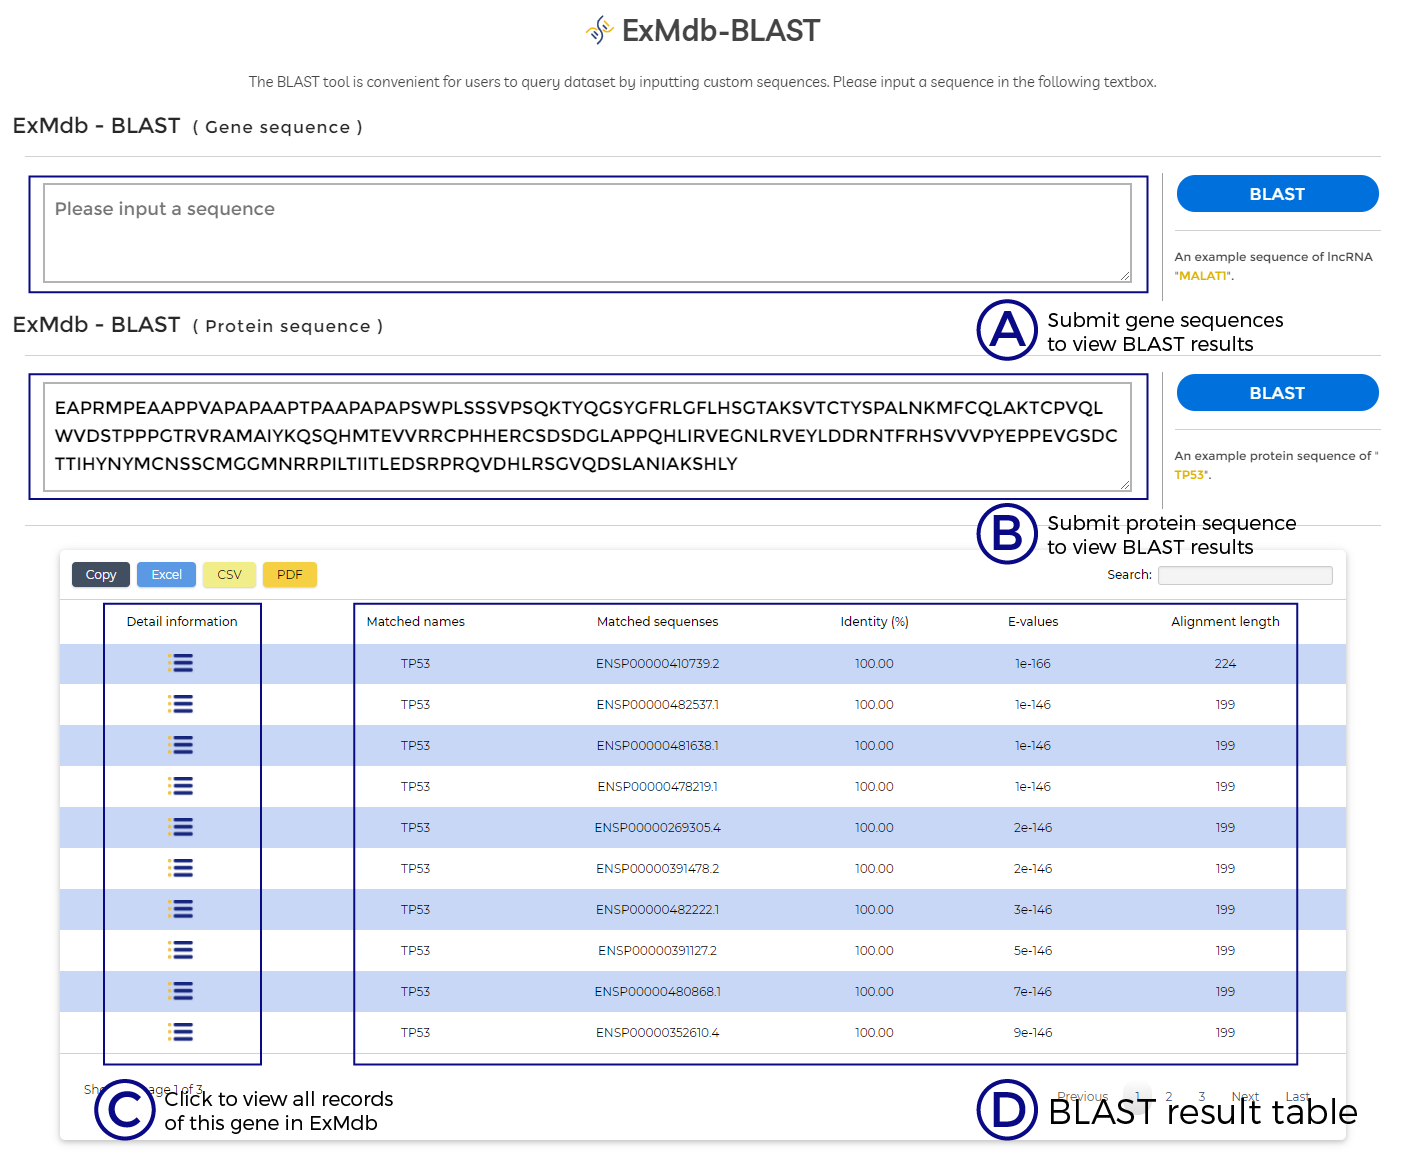
A. Submit gene sequences to view BLAST results.
B. Submit protein sequence to view BLAST results.
C. Click to view all records of this gene in ExMdb.
D. BLAST result table.
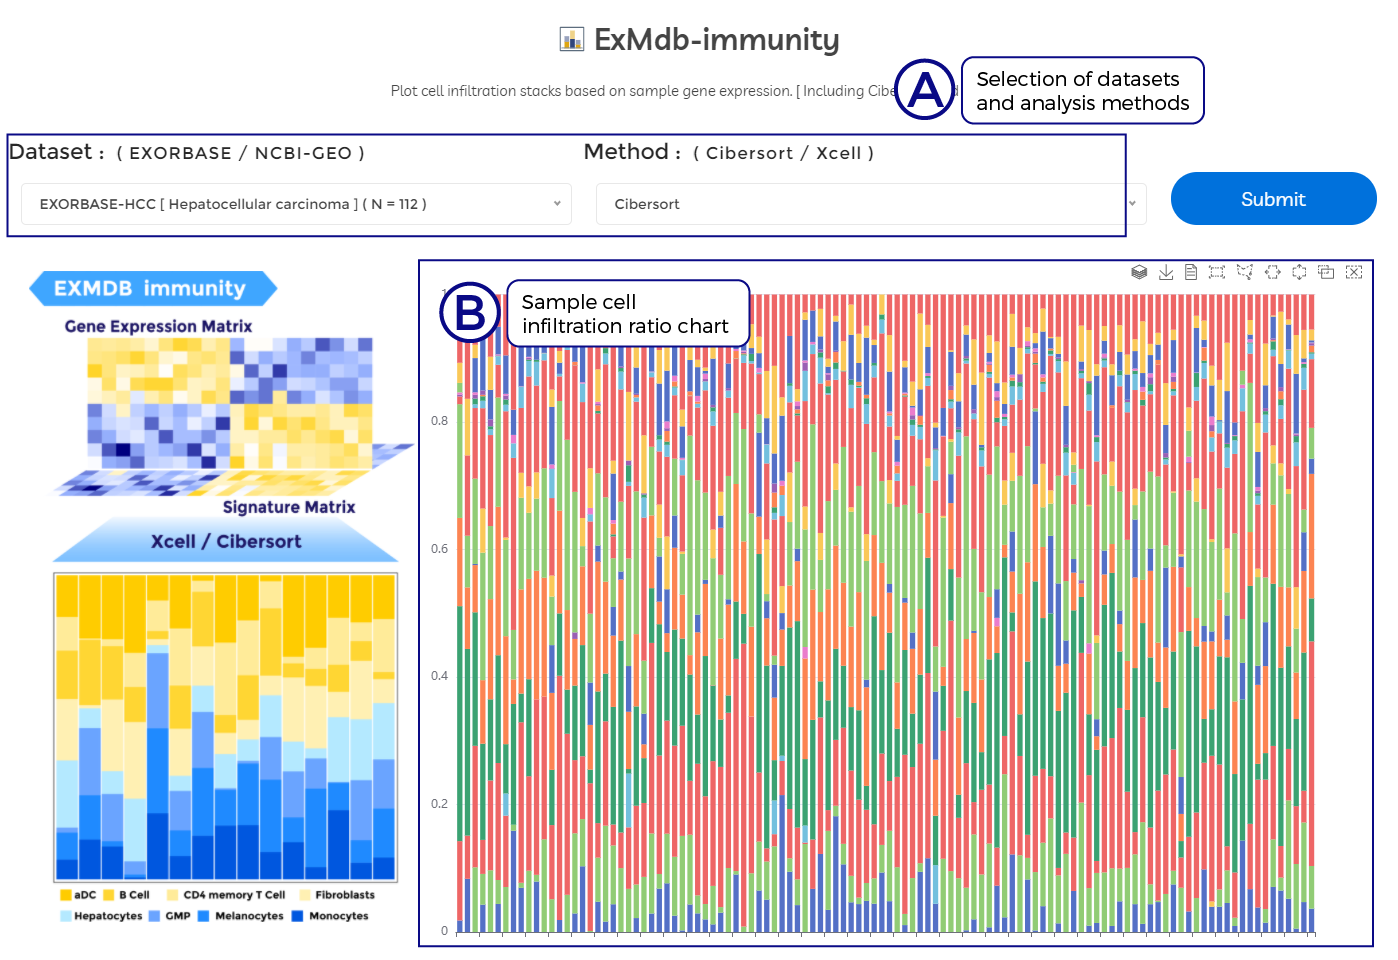
A. Selection of datasets and analysis methods.
B. Sample cell infiltration ratio chart.
C. Click to view all records of this gene in ExMdb.
D. BLAST result table.
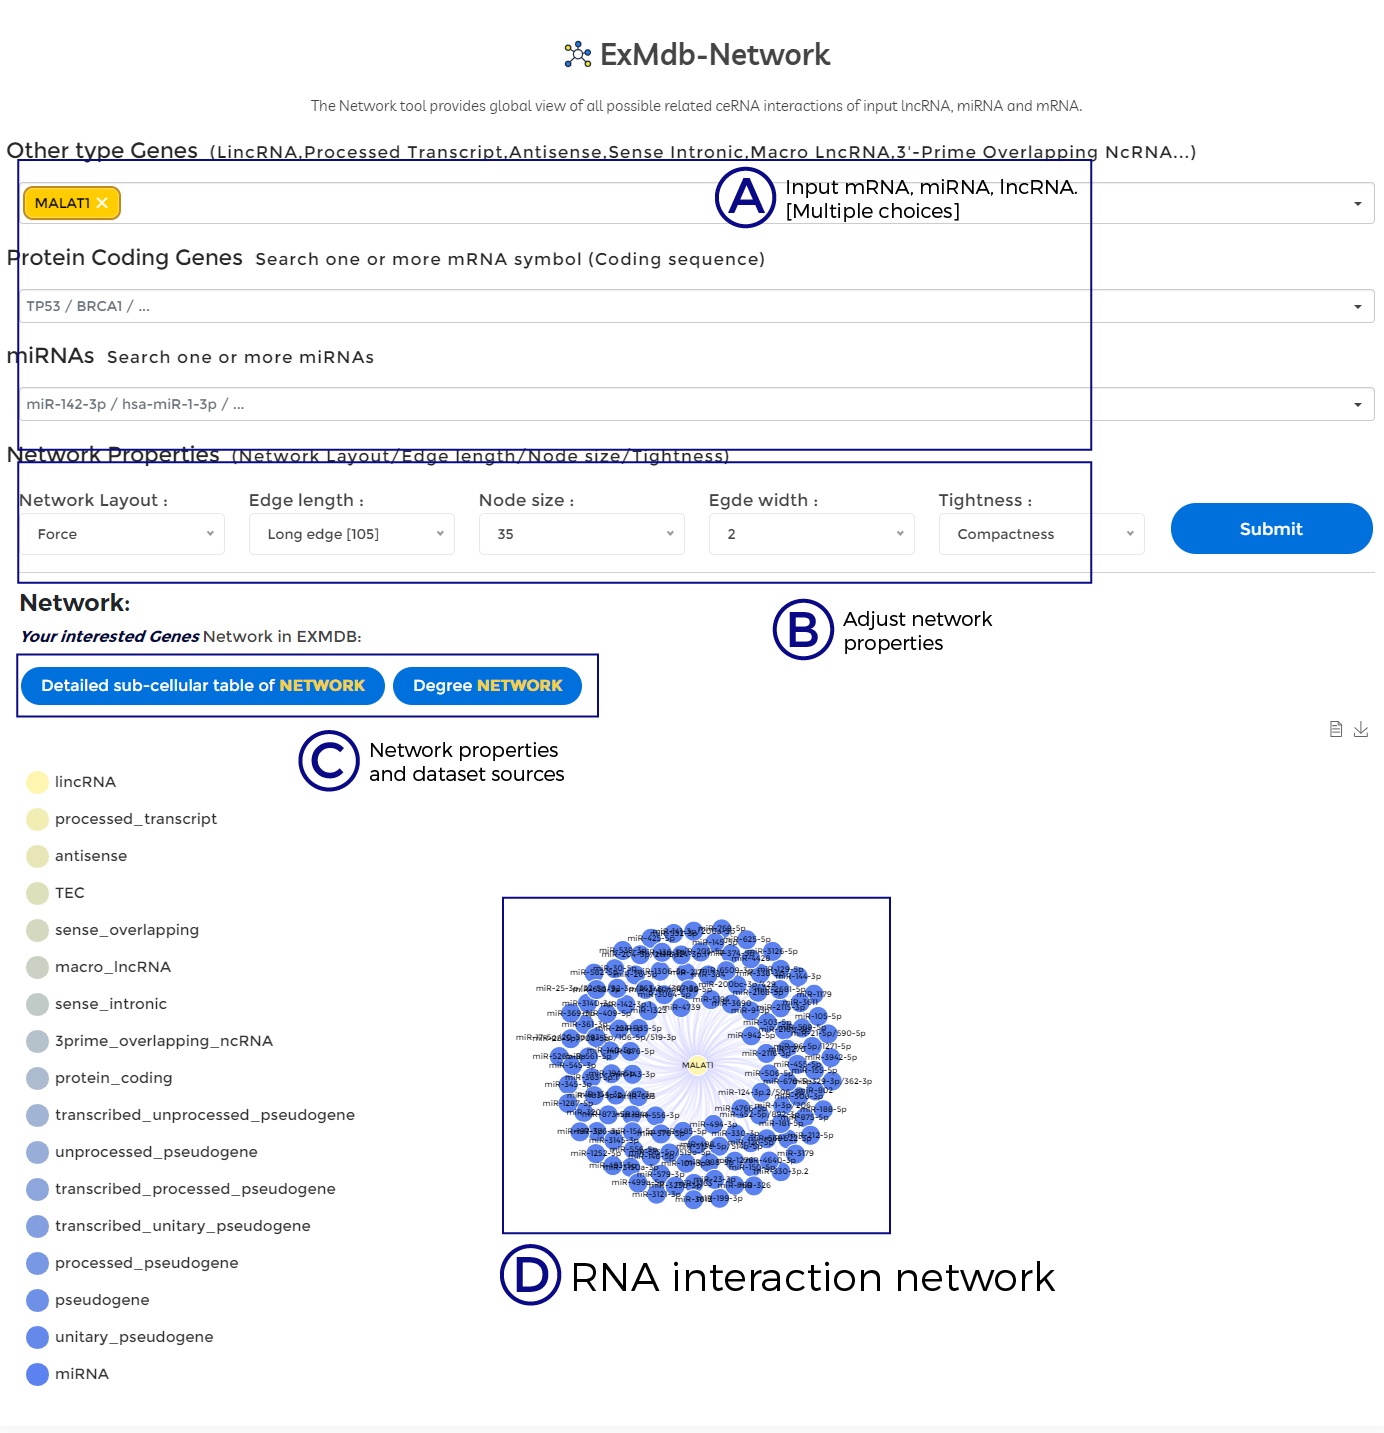
A. Input mRNA, miRNA, lncRNA. [Multiple choices].
B. Adjust network properties.
C. Network properties and dataset sources.
D. RNA interaction network.
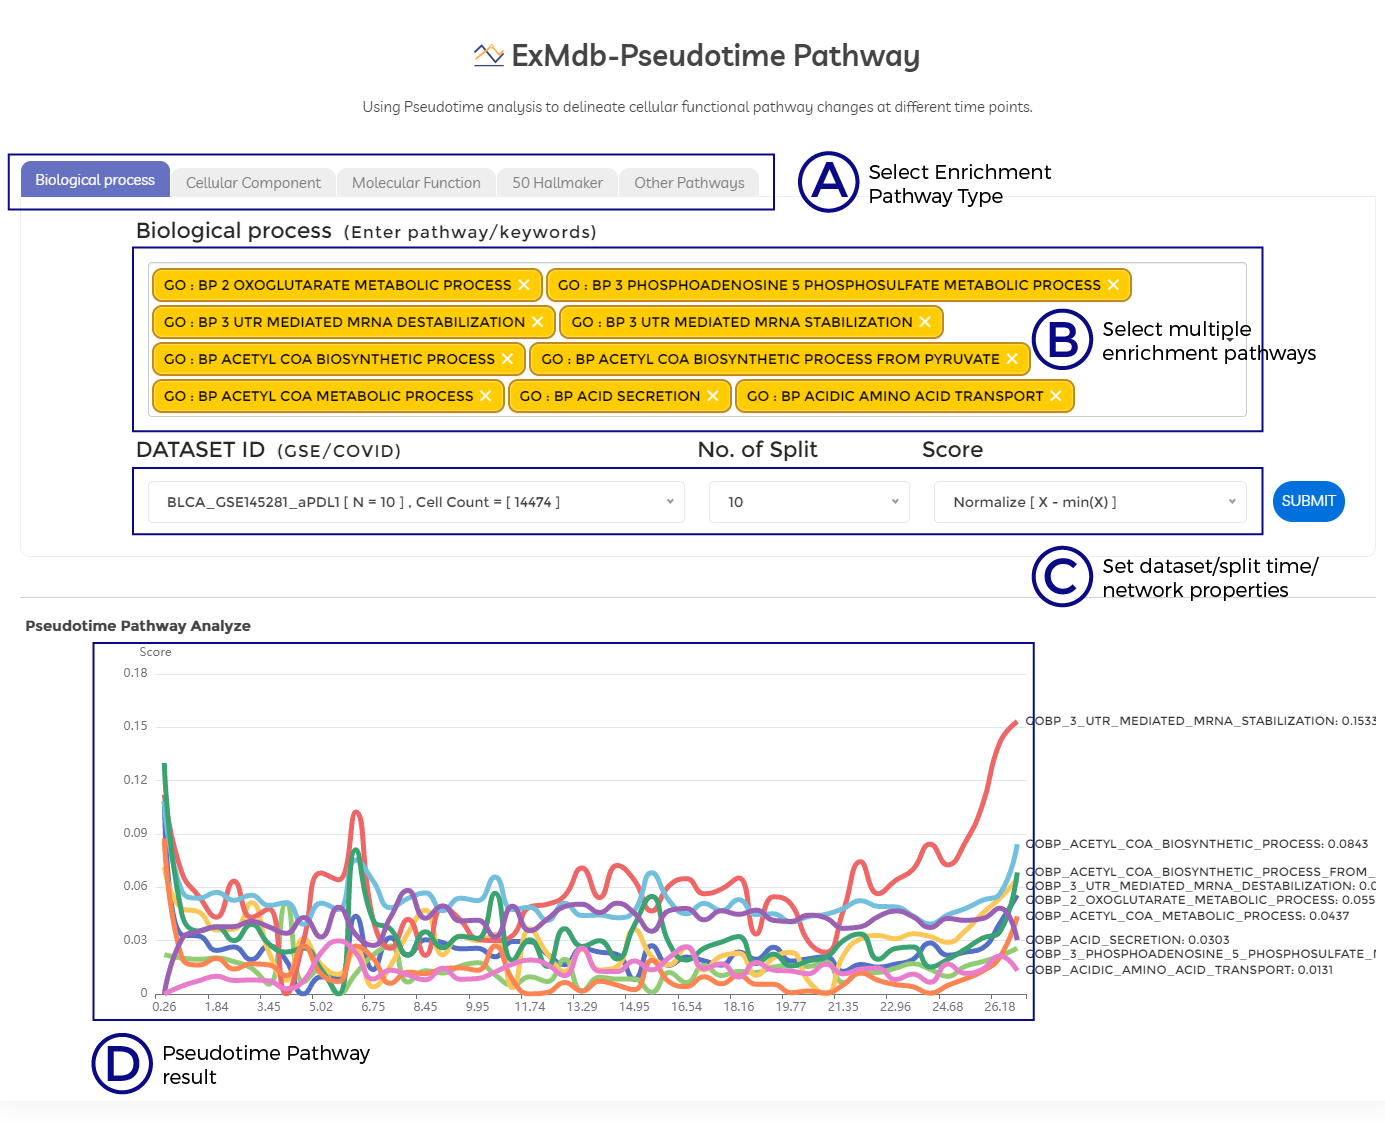
A. Select Enrichment Pathway Type.
B. Select multiple enrichment pathways.
C. Set dataset/split time/network properties.
D. Pseudotime Pathway result.
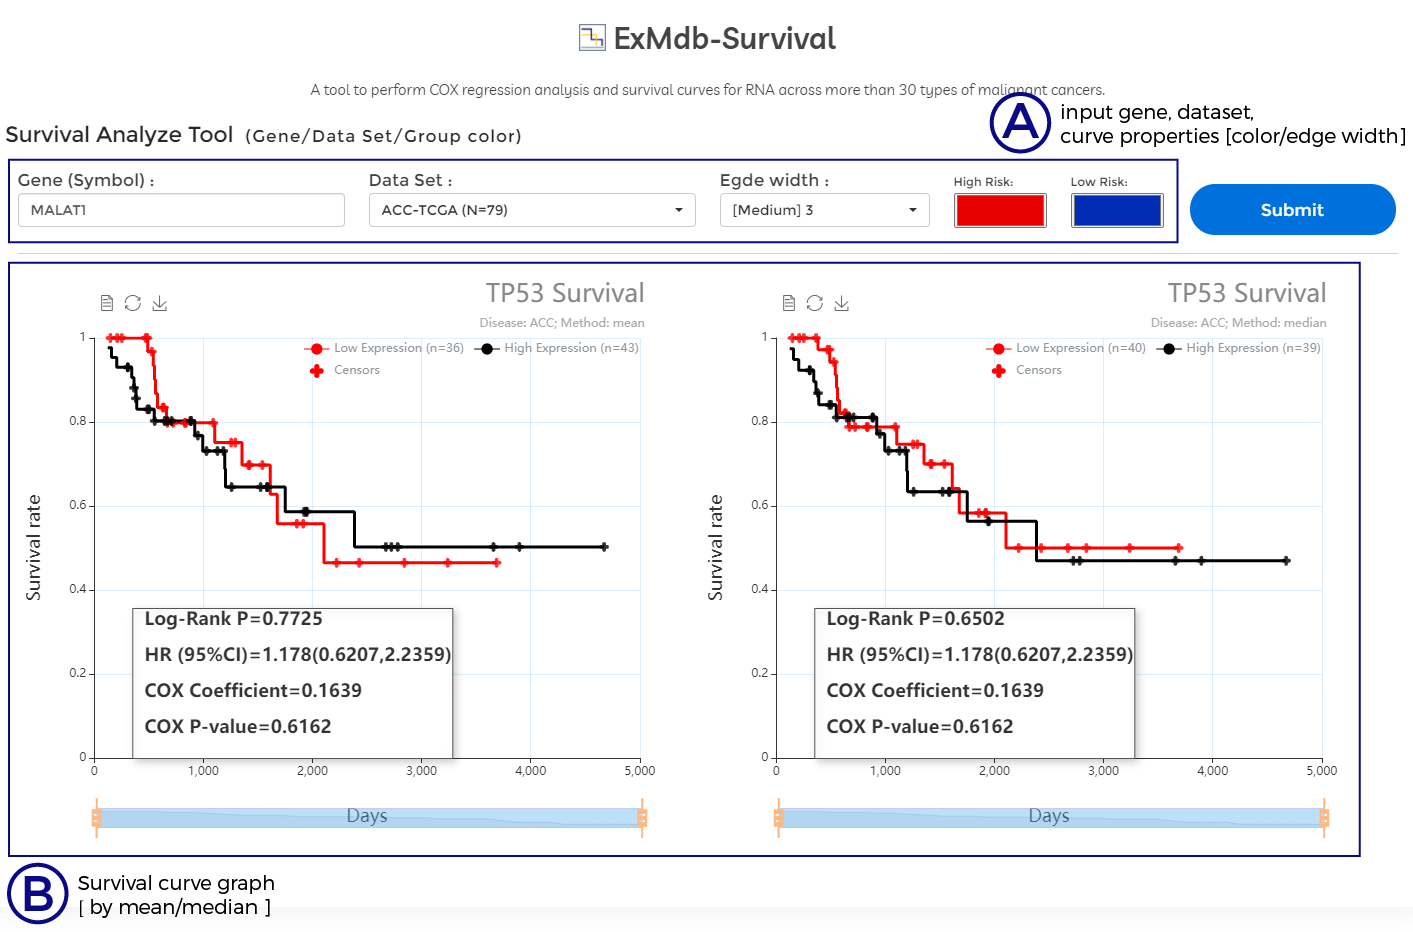
A. input gene, dataset, curve properties [color/edge width]
B. Survival curve graph [ by mean/median ]
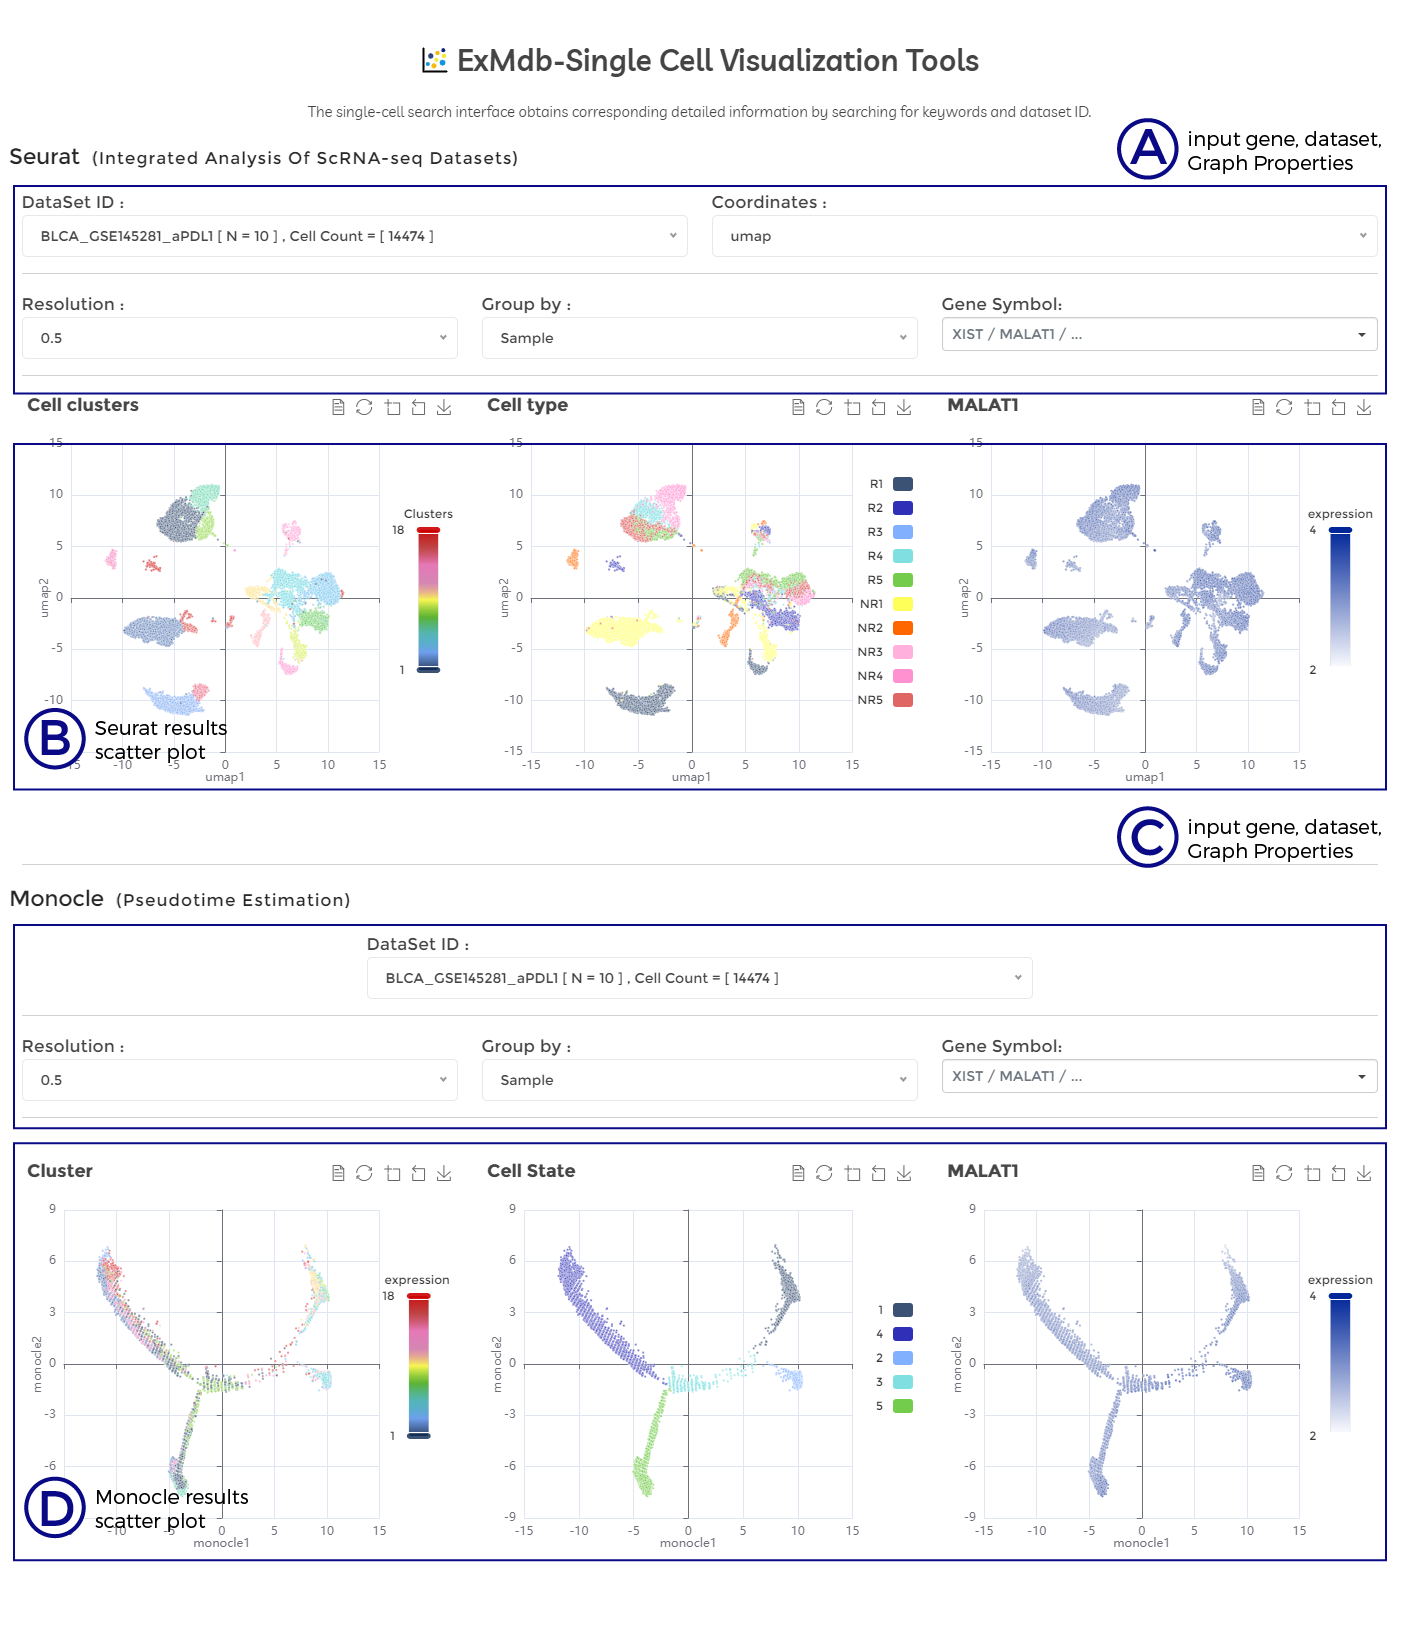
A. input gene, dataset, Graph Properties.
B. Seurat results scatter plot.
C. input gene, dataset, Graph Properties.
D. Monocle results scatter plot.